Breakout Trading: Complete Strategy Guide
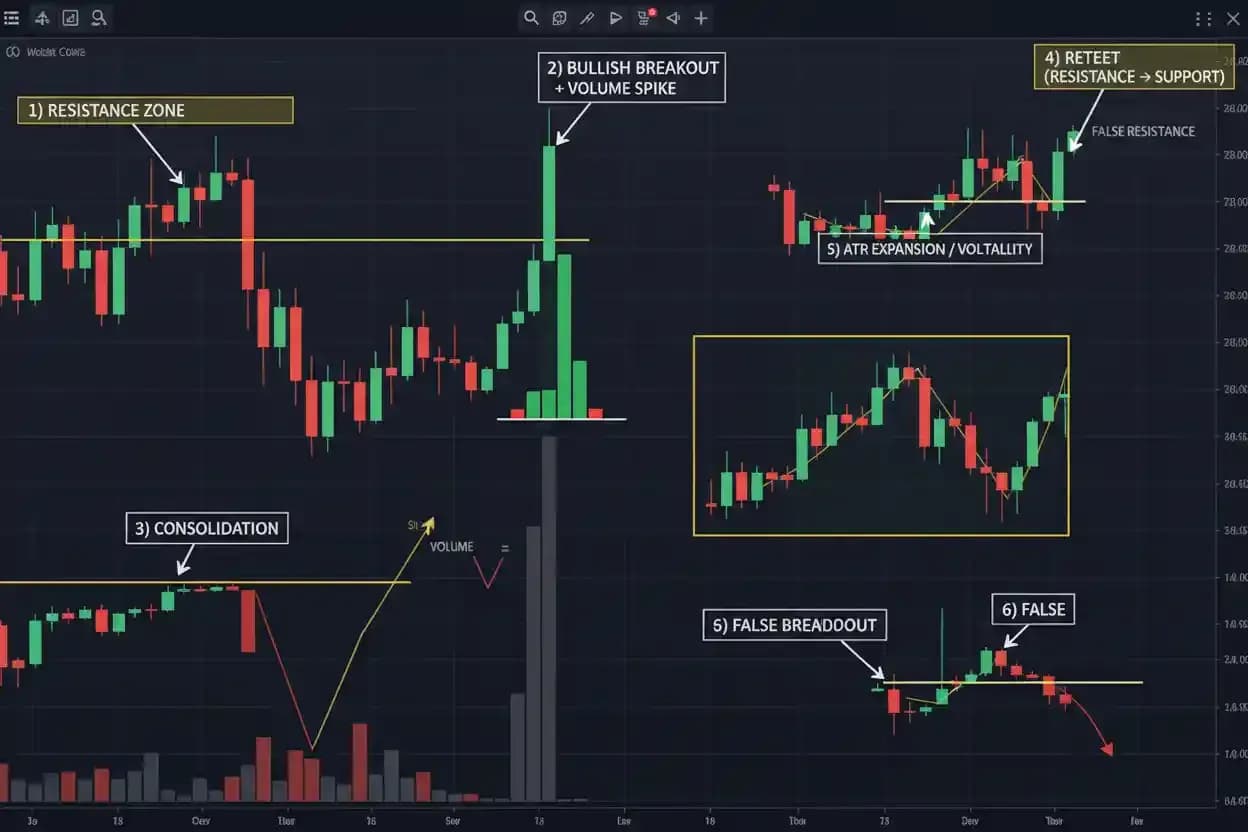
Breakout trading is a strategy built around entering when price moves beyond an established support, resistance, range, trendline or other clearly defined market boundary and begins trading in a new area. The underlying idea is straightforward: when a market has repeatedly failed to move through a level and eventually overcomes it, the balance between buyers and sellers may have changed enough to produce further movement. Breakouts can develop from horizontal ranges, chart patterns, session highs and lows, volatility compression or established trends, and they can occur in forex, gold, indices and other actively traded markets. The difficulty is that not every movement beyond a level becomes a genuine breakout. Price can cross resistance briefly, attract buyers and then reverse sharply, creating a false breakout. A successful breakout trading approach therefore requires more than reacting whenever price crosses a line. Traders need to identify meaningful boundaries, judge whether price is being accepted beyond them, account for volatility and market conditions, choose between immediate and retest entries, and define risk before participating.
Breakout trading also behaves differently from trend trading. A trend trader may enter during a pullback within an already established direction, whereas a breakout trader frequently enters when price escapes a previous range or pushes through a structural boundary. The two approaches can overlap when a breakout extends an existing trend, but the entry logic remains distinct.
What Is Breakout Trading?
Breakout trading focuses on price moving beyond an area that previously contained it. Suppose EUR/USD has repeatedly reached 1.1100 but failed to remain above that level. Traders now recognize 1.1100 as resistance. If the pair later moves decisively through 1.1100 and begins holding above it, the previous ceiling has been broken. A breakout trader may interpret this as evidence that buyers have become strong enough to establish prices in a region that sellers previously defended.
The bearish version occurs when price falls through support. Imagine GBP/USD repeatedly finds buyers around 1.2700. If sellers eventually force price below that level and the pair remains beneath it, the market has moved into an area that was previously rejected. Traders may then look for continuation lower.
The word breakout should not be reduced to a one-pip movement beyond a line. The more useful question is whether the market has genuinely transitioned beyond the previous boundary and whether subsequent price behavior supports that transition.
Why Breakouts Occur
Support and resistance develop because buyers and sellers repeatedly respond around certain price areas. When price reaches resistance, selling pressure may temporarily exceed buying pressure. At support, buying pressure can prevent further decline. These levels can remain intact for hours, days or considerably longer depending on the timeframe.
A breakout occurs when that balance changes. Buyers may absorb available selling around resistance until price can move higher, or sellers may overwhelm demand around support. Stops, pending orders and new breakout entries around obvious levels can add further activity once the boundary is crossed.
This does not mean every breakout represents one simple cause. Markets contain many participants with different objectives. The visible fact is that price was previously contained and has now moved beyond the area. A trader can build a strategy around that observable change without needing to know the exact intention behind every order.
What Makes a Level Suitable for Breakout Trading?
A breakout becomes easier to evaluate when the boundary was clearly relevant before price crossed it. A resistance level tested several times is generally more meaningful than an arbitrary line that price touched only once. The same applies to established support, major range boundaries and recognizable chart structures.
Suppose EUR/USD has reacted around 1.1050 four times over several sessions. Each attempt above the region fails, so many market participants can see the same resistance. If EUR/USD eventually closes decisively above 1.1050, the move carries more structural meaning than crossing a minor intraday level that had little previous influence.
However, more tests do not guarantee a successful breakout. Repeated tests can weaken a level, but they can also establish a strong range that continues trapping price. Traders still need to evaluate what happens after the boundary is crossed.
Resistance Breakouts
A bullish breakout occurs when price moves above resistance and begins trading at higher levels. The strength of the move can be evaluated through the breakout candle, subsequent closes, momentum, volatility, participation and whether price quickly falls back below the old resistance.
Suppose gold repeatedly fails around 2,500. Price eventually rises through the level and closes at 2,525 with a relatively large candle. The next period trades between 2,515 and 2,540 without returning below 2,500. This is stronger evidence of acceptance above resistance than a temporary spike to 2,510 followed by a close at 2,485.
Breakout trading therefore pays close attention to where price closes and whether the market maintains the newly gained territory.
Support Breakdowns
A downside breakout is often described as a support breakdown. Suppose GBP/USD has repeatedly held 1.2700. Sellers eventually push the pair beneath the level, and subsequent trading remains below it.
The former support can then become an area where sellers may reappear during a recovery.
This transition is important because support has not merely been touched; the market has demonstrated that buyers could no longer maintain the previous boundary.
As with bullish breakouts, a temporary move through support is not enough to guarantee continuation. If GBP/USD quickly recovers and closes back above 1.2700, the breakdown may instead become a failed bearish breakout.
Breakout Acceptance
Acceptance describes price behaving as though the market is comfortable trading beyond the previous boundary. It does not require one specific candle pattern.
Suppose EUR/USD breaks above resistance at 1.1100. Price remains above the level for several hours, forms a small consolidation between 1.1110 and 1.1140 and then begins rising again. This suggests that the market is establishing activity above the old ceiling.
Contrast that with a breakout to 1.1125 that reverses immediately and closes below 1.1100. Higher prices were tested but not maintained.
Acceptance is therefore a useful concept because it encourages traders to examine what price does after the initial break rather than focusing only on the moment the line is crossed.
False Breakouts
False breakouts are one of the main risks in breakout trading. Price can move beyond an obvious level, trigger breakout entries and stops, and then reverse back into the previous structure.
Suppose an index has resistance at 5,000. Price rises to 5,030, creating what appears to be a bullish breakout. Buyers enter above the level. Shortly afterward, the index falls below 5,000 and closes at 4,970.
The market failed to maintain prices above resistance.
This does not mean every temporary return below a level invalidates a breakout, but a decisive rejection should make the trader reassess the original thesis.
A breakout strategy must therefore be designed with failed trades in mind rather than assuming that confirmation can eliminate false signals.
Why False Breakouts Happen
False breakouts can occur because the market lacks enough sustained buying or selling pressure to maintain the new area. They can also appear during highly volatile events when price rapidly moves through multiple levels before stabilizing. Obvious highs and lows can attract stop orders and breakout entries, producing short bursts of activity that do not develop into lasting directional movement.
A trader does not need to identify the exact reason in real time. What matters is recognizing the behavioral difference between a breakout that gains acceptance and one that is rejected.
The most dangerous mistake is continuing to defend the breakout thesis after price has clearly returned to the previous structure simply because the initial signal looked strong.
Breakout Trading and Market Structure
Breakouts become more meaningful when they change or extend market structure. Suppose EUR/USD is making higher highs and higher lows. Price then consolidates beneath the latest major high and eventually breaks above it. The breakout extends the bullish sequence.
A breakout can also signal a transition. Imagine GBP/USD has been ranging between 1.2700 and 1.2900. A sustained move below 1.2700 creates the possibility that the previous balance is ending and bearish structure is beginning.
This relationship between breakouts and structural highs or lows makes price context more useful than an isolated indicator signal.
Breakout Trading in Trending Markets
Breakouts in the direction of an established trend can be easier to contextualize because the broader market already has directional structure.
Suppose EUR/USD is in an uptrend and consolidates below resistance after a strong advance. A bullish breakout extends the existing direction. The trader is not trying to predict a complete market transformation; the setup assumes that the previous trend may resume after consolidation.
This does not make trend-aligned breakouts safe. A mature trend can fail during what appears to be one more continuation attempt.
The discussion of trend trading forex vs indices is useful because breakout behavior can vary significantly with market structure and trading hours even when the same directional logic is applied.
Breakouts From Ranges
Range breakouts occur when price leaves a period of relatively balanced trading.
Suppose EUR/USD spends several days between support at 1.0950 and resistance at 1.1050. The range represents temporary balance because neither side has established sustained control outside the boundaries.
If price closes above 1.1050 and continues holding there, the market may be transitioning from balance into directional movement.
Breakout traders are particularly interested in these transitions because a quiet range can give way to much larger movement once one boundary fails.
The important point is that the range should exist before the breakout. A trader who draws boundaries after price has already moved can make almost any chart look like a breakout.
Volatility Compression Before Breakouts
Breakouts frequently develop after volatility contracts. Candle ranges become smaller, price moves within increasingly tight boundaries and market activity may appear subdued.
Compression can create conditions where a relatively small increase in directional pressure pushes price beyond the structure.
Suppose gold trades between 2,480 and 2,500, but the last several sessions narrow progressively until price is moving within only a few dollars beneath resistance. A later move above 2,500 accompanied by expanding ranges may represent a transition from compression to expansion.
The breakout becomes important because the market has shifted from restricted movement to a larger directional range.
ATR Breakout Strategy
An ATR breakout strategy uses Average True Range to help judge whether movement beyond a boundary is meaningful relative to recent volatility.
Suppose EUR/USD normally moves about 12 pips per hour according to ATR. A two-pip movement above resistance may fall comfortably within ordinary noise. A much larger extension accompanied by rising ATR can indicate more meaningful volatility expansion.
ATR does not determine breakout direction and cannot guarantee continuation. Its role is to place the size of the move in context.
This can be particularly useful when comparing breakouts across changing volatility regimes because an absolute price distance that was significant during quiet conditions may become ordinary when market ranges expand.
Bollinger Band Breakout Strategy
A Bollinger Band breakout strategy can be used when price transitions from compressed volatility into expansion. Bollinger Bands contract as standard deviation falls and widen when price variability increases.
Suppose EUR/USD spends an extended period with narrow bands. Price then breaks above an important horizontal resistance level while the upper band expands and overall range increases.
The combination suggests that both structure and volatility are changing.
A move beyond the upper band alone should not be treated as automatic confirmation. Strong trends can remain near the outer band, while brief volatility spikes can push price outside it without creating a sustainable breakout.
Horizontal structure and actual price acceptance still matter.
Asian Range Breakout Strategy
An Asian range breakout strategy focuses on a range established during the Asian trading session and watches whether later market activity breaks above or below it.
This can be relevant in forex because market participation changes significantly as major financial centers open. A relatively quiet Asian period may create a defined high and low, while subsequent European activity can produce greater volatility.
Suppose EUR/USD trades inside a narrow range during Asian hours. London activity begins, and price breaks above the Asian high while volatility expands.
A trader may interpret this as a possible bullish session breakout.
However, Asian range breaks can fail just like any other breakout, especially when price quickly returns inside the earlier range.
Session Timing Matters
Breakout probability and behavior can change according to when the setup occurs. A breakout during a quiet market period may lack participation, while one occurring as a major session becomes active can encounter much greater liquidity and volatility.
This does not mean every London or New York breakout is superior. It means the same technical structure can behave differently depending on the surrounding market environment.
For traders in Pakistan, European forex activity becomes relevant during the daytime, while US markets generally become more active later. Session awareness is particularly important for short-term breakout trading because volatility can change quickly as participation increases.
Immediate Breakout Entry
An immediate breakout entry attempts to participate soon after price moves beyond the level. The primary advantage is that the trader enters before a potential rapid continuation moves far away from the boundary.
The disadvantage is greater exposure to false breakouts.
Suppose EUR/USD resistance is at 1.1100. Price breaks above it and reaches 1.1110. An immediate-entry trader may buy during the move rather than waiting for further confirmation.
If EUR/USD accelerates directly to 1.1180, the early entry benefits from good participation.
If price immediately reverses to 1.1070, the trader has entered directly into a failed breakout.
The choice between early participation and additional confirmation is one of the central trade-offs in breakout trading.
Retest Entry
A retest entry waits for price to break a boundary and then return toward it before participating.
Suppose EUR/USD moves above 1.1100 and reaches 1.1150. Price later pulls back toward 1.1100 but holds above the old resistance. Buyers begin returning, and EUR/USD starts rising again.
The trader may interpret this as a successful retest.
The potential advantages include clearer confirmation and an entry closer to the broken level. The disadvantage is that many strong breakouts never retest, meaning the trader receives no entry.
The breakout entry vs retest entry choice therefore depends on strategy preferences rather than one method always being correct.
Breakout Retest Strategy
A breakout retest strategy generally looks for old resistance to behave as new support after a bullish break or old support to act as new resistance after a bearish breakdown.
The logic is straightforward. If the market has genuinely transitioned beyond the old boundary, price should not necessarily need to return deeply into the previous range.
Suppose GBP/USD breaks below support at 1.2700 and reaches 1.2630. A later recovery stalls around 1.2700 and produces another bearish move. The old support has become a resistance area.
The retest provides a location where the trader can define the bearish thesis more clearly than selling after the initial decline is already extended.
What If There Is No Retest?
Some of the strongest breakouts move immediately and never return to the broken level. A trader waiting exclusively for retests will miss these moves.
This is not necessarily a problem.
Every trading strategy deliberately gives up some opportunities in exchange for a preferred risk structure. Immediate-entry traders participate in more fast breakouts but experience more false starts. Retest traders may receive fewer entries but can sometimes obtain clearer invalidation.
A trader should not abandon the strategy simply because a missed move looks attractive afterward.
Consistency matters more than capturing every breakout.
Breakout Stop-Loss Placement
Breakout stop loss placement should be based on where the breakout thesis becomes invalid rather than on an arbitrary number of pips or points.
Suppose EUR/USD breaks above resistance and successfully retests the level. A bullish trade may become less convincing if price moves decisively back below the retest low and returns into the previous range.
Another breakout setup may require a stop beneath the entire consolidation structure.
The appropriate distance depends on volatility and market structure.
Placing the stop too close can cause ordinary fluctuations to exit a valid trade. Placing it excessively far away increases price risk and generally requires a smaller position.
Stop Placement on Retest Entries
Retest entries often provide relatively clear structural invalidation.
Suppose gold breaks above resistance at 2,500, returns to 2,502 and then begins rising again. If the retest low is 2,492, a trader may determine that a decisive move beneath that region would invalidate the idea that 2,500 has become support.
The exact stop still depends on the strategy and normal volatility.
A trader should avoid placing a stop exactly at an obvious level solely because it produces an attractive reward-to-risk ratio.
The technical structure should determine where the trade becomes wrong; position size should then adapt to that distance.
Position Sizing for Breakout Trades
Breakouts can produce rapid movement, making position sizing particularly important.
Suppose a trader is willing to risk $100. One breakout setup requires a 20-pip stop, while another highly volatile setup requires 50 pips.
The position size for the second trade should generally be smaller if the trader wants to maintain the same monetary exposure.
Using identical size on both trades would expose more money on the wider stop.
The quality of the breakout does not justify abandoning the risk limit. A setup can look perfect and still fail within minutes.
Breakout Profit Targets
A breakout profit target can be based on nearby support or resistance, the height of the preceding range, volatility, reward-to-risk objectives or a trailing structure.
Suppose EUR/USD trades inside a 100-pip range and then breaks upward. Some traders may project the approximate range height above the breakout as one potential reference.
This is an estimate rather than an obligation placed on the market.
If major resistance exists only 40 pips above the breakout, ignoring that level because a textbook range projection says 100 pips would be unrealistic.
Targets should adapt to actual market structure rather than forcing price to conform to a formula.
Range Projection Targets
A common breakout technique projects the height of a range from the breakout point.
Suppose support is at 1.1000 and resistance at 1.1100, creating a 100-pip range. A bullish breakout above 1.1100 might produce a theoretical projection near 1.1200.
The calculation provides a planning reference.
However, price may stop at 1.1150, continue well beyond 1.1200 or fail immediately.
A range projection is therefore useful for estimating possible reward, but it should be compared with actual support, resistance and changing market behavior throughout the trade.
Trailing a Breakout Trade
When a breakout develops into a trend, a trader may choose to trail the stop rather than exit at one fixed target.
Suppose EUR/USD breaks a major range and begins producing higher highs and higher lows. A trader could move the protective stop below successive higher lows as the trend develops.
The advantage is that a successful breakout can produce a much larger gain than initially expected.
The disadvantage is that normal pullbacks can trigger the trailing stop before the larger trend resumes.
Trailing methods should therefore match the timeframe and volatility rather than following every small market fluctuation.
Breakout Trading Strategy Design
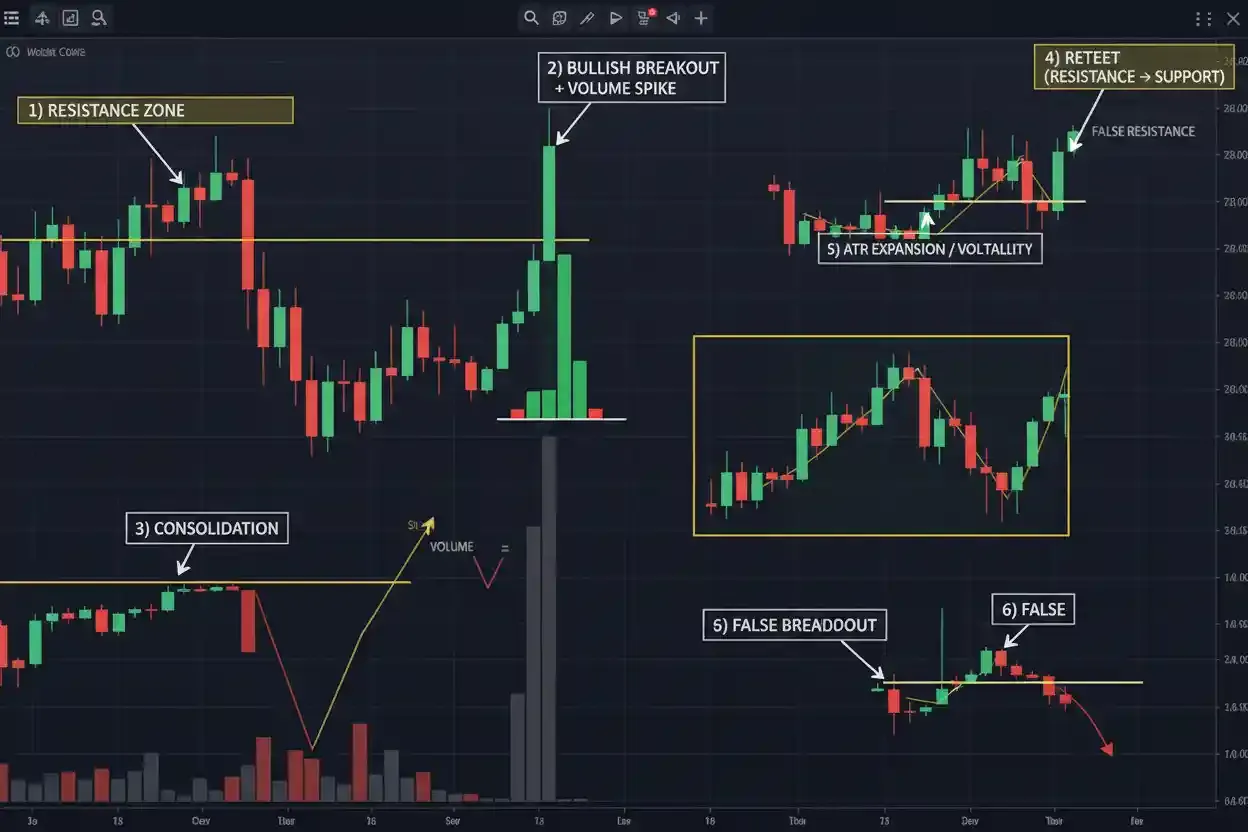
A complete breakout trading strategy needs explicit rules for the type of level, confirmation method, entry, invalidation, position size and exit. Simply writing "buy resistance breakouts" is not enough because traders will encounter many ambiguous situations.
A strategy might require a clearly established range, a candle close beyond the boundary, volatility expansion and a maximum distance from the breakout level before entry. Another method might ignore candle closes and use immediate execution once price reaches a specified threshold.
Neither framework eliminates losing trades.
The purpose of rules is to make similar situations more consistent so results can be evaluated meaningfully.
Breakouts and Trend Trading
Breakout trading and trend trading frequently overlap. A strong trend often pauses in a consolidation before breaking again in the original direction.
Suppose gold is in an uptrend and develops a narrow range beneath a new high. A bullish breakout from the range can be viewed simultaneously as a breakout setup and a trend-continuation setup.
The trader can use the existing trend to provide directional context while the breakout structure controls the entry.
This combination is often clearer than trying to trade every breakout regardless of the larger market environment.
Breakouts and Reversal Trading
A breakout can also confirm a reversal. Suppose EUR/USD has been in a downtrend but forms a double bottom around major support. The pair later breaks above the resistance between the two lows.
The bullish breakout now supports a possible transition from bearish structure toward a new upward phase.
This is where breakout trading intersects with reversal trading.
The difference lies in context: a continuation breakout extends the existing trend, while a reversal breakout crosses a level that helps invalidate the previous directional structure.
The principles of confirmation, retest and risk remain relevant in both cases.
Breakouts vs Mean Reversion
Breakout trading and mean reversion trading can produce conflicting signals. A breakout trader sees price leaving a range and expects expansion to continue. A mean-reversion trader may see price stretched beyond its recent average and expect it to return.
Both can be rational depending on market regime.
During persistent trends, fading every breakout can be costly. During stable ranges, buying every move above resistance can produce repeated false signals.
The trader therefore needs to understand whether current conditions favor sustained expansion or repeated reversion.
The mean reversion timeframe also matters because price can be extended on a five-minute chart while remaining completely normal on a daily chart.
Breakout Trading and Volume
Participation can help evaluate breakout quality when useful volume or tick-volume data is available.
Suppose an index trades beneath resistance for several sessions. When price eventually breaks the level, volume increases significantly relative to recent activity.
The stronger participation can support the interpretation that the breakout has attracted broader interest.
However, high-volume breakouts can still fail. Extreme activity may also occur near exhaustion or during news-driven volatility.
Volume should therefore add context rather than become a requirement that supposedly guarantees continuation.
Breakout Trading and Momentum
Momentum can help distinguish an expanding breakout from a weak drift through a level.
Suppose EUR/USD moves above resistance while candle ranges increase and upward momentum strengthens. The market is not merely crossing the line; it is accelerating beyond it.
Another breakout may move only slightly above resistance while momentum weakens immediately.
The first example may appear more convincing, but even powerful momentum can reverse.
Momentum should therefore be used to describe the character of the move, not to justify uncontrolled risk.
Breakout Trading and Volatility
Volatility is central to breakout trading because successful breakouts often involve expanding market ranges.
A trader should understand what normal movement looks like before deciding whether a particular breakout is significant.
Suppose EUR/USD regularly moves 40 pips per hour during current conditions. A three-pip move beyond resistance may represent little more than ordinary noise.
If the pair instead breaks 25 pips above the level while volatility expands, the move is more substantial relative to recent behavior.
This does not prove continuation, but it improves the trader's understanding of whether the breakout has materially changed the market environment.
Breakout Trading Around News
Economic announcements can create powerful breakouts but also some of the most difficult execution conditions. Price may move rapidly through support or resistance as market expectations change.
A breakout around major data can travel far within seconds, spreads may widen and execution can differ from the requested price.
The first directional move can also reverse sharply.
Traders who rely on ordinary technical breakout behavior should therefore recognize that event-driven markets can behave very differently from gradual range breaks.
A clean chart pattern before an announcement does not control how price responds to new information.
Breakout Trading in Forex
Breakout trading is widely used in forex trading because currency pairs regularly develop session ranges, horizontal consolidations and reactions around previous highs and lows.
A forex trader might watch an Asian-session range, the previous day's high, a major four-hour resistance level or a multi-day consolidation.
Suppose EUR/USD breaks the previous daily high during active European trading and remains above it. The trader can evaluate whether the move aligns with the broader structure and whether volatility is expanding.
Forex traders should also remember that central-bank statements and economic releases can turn ordinary breakout setups into highly volatile events.
Breakout Trading in Gold
Gold frequently produces strong breakouts when macroeconomic expectations change or when important technical levels fail.
Suppose gold spends several sessions beneath 2,500 and repeatedly fails there. Price eventually breaks through the level and accelerates higher.
The breakout may offer an attractive setup if it remains supported above the old resistance.
Gold can also generate substantial false moves. Price may trade $20 or $30 beyond an apparent boundary and reverse rapidly during volatile conditions.
This is why breakout distance should always be interpreted relative to current gold volatility rather than using one fixed dollar threshold.
Breakout Trading in Indices
Indices commonly create breakouts around opening ranges, previous session highs and lows, consolidation zones and major longer-term resistance.
US indices can move particularly quickly after the underlying market opens.
A breakout that occurs during a quieter pre-market or off-session period may behave differently once full participation arrives.
For traders in Pakistan, the most active US index periods generally occur later in the local day, so monitoring requirements should be considered before using a very short-term breakout strategy.
A position that requires immediate management during a fast market should fit the trader's actual schedule.
Breakout Trading in Cryptocurrency Markets
Breakout strategies can also be applied to supported cryptocurrency instruments, where long consolidations are sometimes followed by substantial directional moves.
The challenge is volatility. Crypto can move through a technical level by a significant percentage and still reverse quickly.
A breakout trader should therefore avoid treating a large candle alone as proof of acceptance.
The behavior after the move, relevant volatility, position size and structural invalidation remain important.
Higher volatility also means that stops suitable for a quiet forex pair may be completely inappropriate for a crypto instrument.
Forex vs Index Breakout Behavior
Forex and index markets can both produce breakout setups, but their trading rhythms can differ. Currency markets operate continuously through the major global sessions during the business week, while equity indices often experience pronounced changes in participation around the underlying exchange open.
The comparison between reversal trading forex vs indices also illustrates why the same chart concept can behave differently across instruments. Session structure, gap behavior, liquidity and typical volatility all influence how breaks and reversals develop.
A breakout strategy should therefore be tested and interpreted in the market where it will actually be used instead of assuming one rule behaves identically everywhere.
Breakout Trading on MetaTrader 5
Traders can monitor supported instruments and technical levels using the MetaTrader 5 platform. Horizontal lines, trendlines and price alerts can help identify when a market approaches an important breakout area.
A clean chart is usually sufficient. The trader needs to see the structure, relevant boundaries and current volatility without covering price with unnecessary indicators.
The exact platform setup matters less than having consistent definitions for what constitutes a level, what confirms a breakout and where the setup becomes invalid.
Different traders can use different visual tools while following the same underlying breakout principles.
Breakout Trading for Traders in Pakistan
Breakout trading itself does not change for traders in Pakistan, but session timing affects when many short-term setups become active. European currency trading develops during Pakistan's daytime, while US index and New York forex activity generally becomes important later.
A trader following EUR/USD may therefore see a quiet range establish earlier and stronger movement develop as European participation increases.
Someone trading US indices may need to be available later in the day if the strategy focuses on opening-range breaks.
The timeframe should fit the trader's schedule. A four-hour breakout can be much easier to monitor than a five-minute setup requiring immediate responses.
Breakout Trading in Khyber Pakhtunkhwa
Traders in Peshawar, Mardan, Abbottabad, Swat, Kohat, Nowshera, Bannu, Mansehra, Haripur, Swabi and other parts of Khyber Pakhtunkhwa can use the same breakout principles because the underlying global market structure is unchanged by location.
Practical considerations still matter. A trader with limited monitoring time may prefer higher-timeframe ranges and structural breaks. Someone able to follow London forex activity during Pakistan's daytime can work with shorter session-based setups.
Connectivity also deserves consideration. A breakout can move rapidly once a boundary fails, so strategies that depend on second-by-second manual intervention can become difficult to manage if internet access is interrupted.
Breakout Trading Psychology
Breakouts create strong psychological pressure because the market often appears most exciting precisely when price is moving fastest. A trader watching resistance fail may fear missing a large move and enter much farther from the level than the original strategy allowed.
This is chasing.
Suppose EUR/USD breaks resistance at 1.1100 and rapidly moves to 1.1160. The trader planned to enter close to the breakout but buys at 1.1160 because the move looks unstoppable. The nearest logical invalidation may still sit below 1.1100, creating a much worse reward-to-risk relationship.
A valid breakout does not automatically make every later entry attractive.
Fear of False Breakouts
The opposite psychological problem occurs after several losing breakout trades. A trader becomes so concerned about false signals that every valid move is ignored until price has traveled too far.
There is no confirmation method that removes uncertainty completely.
Waiting for a candle close, retest, momentum confirmation and additional structure may reduce some false entries, but it can also result in later prices.
A breakout strategy should define how much confirmation is required beforehand so the trader is not changing the rules after each recent win or loss.
Re-Entering After a Failed Breakout
A failed breakout does not necessarily mean the level will never break again. Price can attempt a boundary several times before establishing a sustainable move.
Suppose EUR/USD breaks 1.1100, fails and falls back into the range. Several hours later, buyers return and price approaches resistance again.
A trader should evaluate the new setup according to the strategy rather than assuming that the previous failure guarantees another one.
At the same time, repeatedly entering every tiny movement above the same level can cause a series of losses.
The strategy needs a clear reset condition that determines when a fresh breakout attempt becomes valid.
Common Breakout Trading Mistakes
Many breakout losses come from execution rather than from misunderstanding the basic concept. Traders may choose insignificant levels, enter after price is already extended, ignore volatility, chase large breakout candles, place stops inside normal market noise or assume that every retest must hold. Others treat strong momentum as proof that a breakout cannot fail, or dramatically increase position size because the setup looks unusually convincing.
The central discipline is simple: identify the boundary before the breakout, define what confirms the move, know where the idea becomes invalid and calculate risk before entering. If those decisions are made only after price begins moving, emotion can easily replace the strategy.
Trading Every Break of a Line
A chart can contain countless highs, lows and manually drawn trendlines. If every movement beyond one of them is considered a breakout, traders will generate signals constantly.
A meaningful breakout requires a meaningful boundary.
Suppose price crosses a minor five-minute high that had little influence on recent trading. Calling this a major breakout simply because a line can be drawn through the high creates unnecessary noise.
Levels should be selected based on actual market structure, not on the trader's desire to create more setups.
Chasing Large Breakout Candles
Large breakout candles are visually persuasive because they make the direction look obvious. They can also create poor entry location.
Suppose gold breaks resistance at 2,500 and immediately reaches 2,540. Buying near 2,540 may mean the logical stop still sits below 2,500 while nearby resistance exists at 2,550.
The breakout itself may be genuine, but the specific trade offers little remaining upside relative to the required risk.
A trader can correctly identify the market direction and still make a poor entry.
Using Stops That Ignore Volatility
A fixed ten-pip stop may work very differently depending on the market environment.
Suppose EUR/USD hourly ATR is only eight pips during quiet conditions. A ten-pip stop provides more room than an average hourly range.
If ATR rises to 30 pips, the same stop now sits well inside normal movement.
Breakout strategies often operate during volatility expansion, making static stop distances particularly vulnerable.
Technical invalidation should be evaluated together with the current range environment.
Assuming Every Retest Must Hold Exactly
A broken resistance level does not always become precise support at the exact same price.
Suppose EUR/USD breaks 1.1100 and later retests the area. Price briefly trades at 1.1092 before recovering.
A trader using 1.1100 as an exact mathematical barrier may declare the breakout failed even though the broader region ultimately held.
Markets frequently react around zones rather than one perfect number.
The amount of tolerance should reflect volatility and structure rather than being adjusted after the fact to preserve a trade.
Breakout Risk Management
Breakout trading can produce rapid profits when a move expands, but this potential should not encourage excessive leverage. False breakouts are a normal part of the strategy.
Suppose a trader expects that only a portion of breakouts will develop into sustained moves. The risk on each failed attempt needs to remain small enough that several losses can occur without creating severe damage.
This is one reason breakout strategies often focus on asymmetric opportunities: controlled loss if the market returns through invalidation, with the possibility of larger gains when a breakout develops into a substantial trend.
The concept works only if loss size remains controlled.
A Practical Bullish Breakout Example
Suppose EUR/USD has traded between 1.0950 and 1.1050 for several days. Repeated attempts above 1.1050 fail, making the resistance obvious. As the range matures, price begins spending more time near its upper boundary and pullbacks become shallower.
EUR/USD eventually closes above 1.1050 at 1.1070. Instead of immediately returning into the range, it consolidates between 1.1060 and 1.1085. Price later pulls back toward 1.1055 and buyers return.
The setup now contains a meaningful prior range, a close above resistance, acceptance outside the range and a successful retest.
A trader may consider a bullish entry while defining a return deep inside the previous range as evidence that the breakout has failed.
A Practical Bearish Breakout Example
Suppose GBP/USD has support around 1.2700. The level has held several times, but each recovery becomes weaker and lower highs continue developing.
Price eventually closes at 1.2670. The next recovery reaches 1.2695 but fails to reclaim 1.2700, and GBP/USD begins falling again.
The old support is now acting as resistance.
This structure creates a clearer bearish setup than simply selling the first tick below 1.2700.
If GBP/USD later recovers above the prior support and maintains trading there, the bearish breakout thesis should be reassessed.
A Practical False Breakout Example
Suppose gold has resistance around 2,500. Price rises rapidly to 2,520 and appears to break the level. Traders buy the move.
Gold then reverses during the same period and closes at 2,490. The following candle forms a lower high below 2,500 and price later breaks short-term support.
The original breakout has failed.
A disciplined breakout trader accepts the failure rather than widening the stop simply because the initial move looked powerful.
The failed breakout can also become useful information for traders considering a bearish scenario, though the reversal itself still requires its own risk plan.
A Practical ATR Breakout Example
Suppose EUR/USD has spent several hours below resistance at 1.1100, while the 14-period hourly ATR is approximately 10 pips. Price repeatedly trades within five or six pips of resistance without breaking it.
A later candle moves above 1.1100 and reaches 1.1125 while ATR begins increasing toward 15 pips.
The 25-pip extension is substantial relative to the earlier hourly environment.
This does not guarantee a successful bullish trend, but the movement represents a more meaningful volatility change than a one- or two-pip crossing.
The trader can then evaluate whether price remains above resistance or falls back into the old range.
A Practical Breakout Retest Example
Suppose an index has resistance at 5,000. Price breaks higher and reaches 5,060 before pulling back.
The retest reaches 5,008 and stabilizes. Sellers attempt to push the index back below 5,000 but cannot maintain the move. Price begins producing higher lows above the previous resistance and then rises toward 5,050 again.
This behavior supports the idea that the market is accepting prices above the old boundary.
A trader using the retest approach has a clearer structural reference for invalidation than someone chasing the initial move at 5,060.
The setup can still fail if price later returns decisively inside the original range.
Building a Breakout Trading Routine
A practical breakout trading routine begins before price crosses the level. Identify a meaningful range, support, resistance or other structural boundary and determine why it matters. Observe whether volatility is contracting or whether price is repeatedly pressing against the boundary. Decide in advance whether the strategy requires immediate entry, a candle close or a retest. Once the breakout occurs, evaluate whether price is gaining acceptance beyond the level rather than focusing only on the initial spike. Define the invalidation point using actual market structure and adjust position size to keep financial exposure within the planned limit.
A short checklist can help keep the process disciplined:
- Use a clearly established market boundary.
- Define breakout confirmation before entry.
- Account for current volatility.
- Know the invalidation level and position size.
- Avoid chasing after price has moved too far from the breakout.
These rules do not eliminate failed trades, but they reduce the tendency to make the strategy up after the market starts moving.
Breakout Trading FAQs
What is breakout trading?
Breakout trading is a strategy that attempts to participate when price moves beyond established support, resistance, a range or another meaningful market boundary.
What is a bullish breakout?
A bullish breakout occurs when price moves above resistance and begins trading at higher levels.
What is a bearish breakout?
A bearish breakout occurs when price falls below support and begins maintaining lower prices.
What is a false breakout?
A false breakout occurs when price crosses a boundary but fails to sustain the move and returns to the previous structure.
How can I confirm a breakout?
Traders may use candle closes, sustained trading beyond the level, retests, volatility expansion, momentum or participation as confirmation, although none guarantees success.
Should I enter immediately after a breakout?
Some strategies do. Immediate entries can capture fast moves but are more exposed to false breakouts.
What is a breakout retest?
A retest occurs when price returns toward a broken boundary after initially moving through it.
Is a retest required?
No. Some strong breakouts continue without returning to the original level.
Is a retest entry better than an immediate entry?
Neither is universally better. Retests can provide clearer structure, while immediate entries participate in moves that never pull back.
Can old resistance become support?
It can. After a bullish breakout, previous resistance sometimes becomes an area where buyers become active.
Can old support become resistance?
Yes. After a bearish breakdown, former support can become resistance during a recovery.
What is an ATR breakout strategy?
It uses Average True Range to help judge whether movement beyond a level is meaningful relative to recent volatility.
What is a Bollinger Band breakout strategy?
It uses changing band width and price behavior to evaluate transitions from volatility compression into expansion.
What is an Asian range breakout?
It focuses on price breaking above or below a range established during the Asian forex session.
Does high volume confirm a breakout?
Higher participation can strengthen the evidence, but high-volume breakouts can still fail.
Does a large breakout candle guarantee continuation?
No. Large candles can be followed by pullbacks, consolidation or complete reversals.
How should a breakout stop be placed?
The stop should generally reflect where the breakout thesis becomes invalid while accounting for normal market volatility.
How are breakout profit targets calculated?
Targets may use nearby support or resistance, projected range height, volatility or a trailing trend structure.
Can breakout trading be combined with trend trading?
Yes. Breakouts in the direction of an established trend are common continuation setups.
Can breakouts signal reversals?
Yes. A breakout through an important opposing structural level can help confirm a possible trend reversal.
Is breakout trading suitable for forex?
Yes. Forex markets regularly form ranges, session boundaries and structural levels that can produce breakout setups.
Can breakout trading be used for gold?
Yes, although gold's volatility can create significant false breaks and rapid price movement.
Can breakout trading be used for indices?
Yes. Opening ranges, previous session levels and consolidations are commonly watched by index traders.
Can breakout trading be used for cryptocurrency markets?
Yes, but high crypto volatility can increase both breakout size and false-signal risk.
Which timeframe is best for breakout trading?
There is no universal best timeframe. Short timeframes create more frequent signals, while higher timeframes generally produce broader structures and slower setups.
Do breakouts work differently in Pakistan?
The market mechanics are the same. Traders in Pakistan mainly need to account for international session timing when using short-term breakout strategies.
Is breakout trading different for traders in KPK?
No. Traders in Peshawar, Mardan, Abbottabad, Swat and other KPK locations can use the same breakout principles. Monitoring time and connectivity may influence the most practical timeframe.
What is the biggest breakout trading mistake?
One of the biggest mistakes is chasing price after it has already moved too far from the breakout level.
Can breakout trading guarantee profits?
No. False breakouts are unavoidable, and even strongly confirmed setups can fail.
Disclaimer: Breakouts can fail or reverse without warning, and leverage can magnify losses. This article is educational information only, not personalized financial or trading advice.

Trade forex, gold, and indices with Medatiq Markets
Enjoy tight spreads and fast execution, built for market condition.