Mean Reversion Trading: Strategies, Signals & Risk

Mean reversion trading is a strategy based on the idea that price can move unusually far from a reference value and later return toward a more typical level. The reference may be a moving average, VWAP, statistical mean, Bollinger Band centerline, recent trading range or another measure of equilibrium. Instead of buying because price is already moving higher or selling because a decline is accelerating, a mean reversion trader often looks for situations where movement has become stretched relative to recent conditions and the probability of a partial normalization appears attractive. The strategy can work well in balanced or range-bound markets, but it can become dangerous during powerful trends because price may remain extended much longer than expected. A market that looks overbought can continue rising, while an oversold instrument can continue falling sharply. Successful mean reversion trading therefore requires more than identifying distance from an average. Traders need to understand market regime, volatility, timeframe, structural support and resistance, entry confirmation, position sizing and the point where the idea that price should revert is no longer valid.
Mean reversion trading sits almost opposite trend trading in its basic logic. A trend trader assumes directional persistence may continue, while a mean reversion trader expects excessive movement to normalize. The two approaches can both be valid at different times because markets alternate between trending, ranging, compressing and expanding conditions. The challenge is recognizing which environment is present before applying the strategy.
What Is Mean Reversion Trading?
Mean reversion trading attempts to profit from movement back toward a reference level after price has deviated from it. The "mean" does not need to be a perfect mathematical average. Depending on the strategy, traders might use a 20-period moving average, VWAP, the midpoint of a range or a statistically calculated equilibrium.
Suppose EUR/USD has traded around a 20-period moving average for several sessions. Price suddenly falls well below that average without breaking important higher-timeframe support. Selling momentum then begins weakening, and the market starts moving back toward the average. A mean reversion trader may attempt to capture part of that recovery.
The important point is that price being far from the mean does not itself create a trade. The trader still needs to determine whether the deviation is temporary or whether the market has entered a new directional regime in which the old average is becoming irrelevant.
Why Prices Revert Toward a Mean
Markets can become temporarily stretched because of short-term order imbalance, emotional reactions, sudden volatility, thin liquidity or aggressive positioning. Once that temporary pressure fades, buyers or sellers may bring price back toward a more balanced region.
Imagine EUR/USD trades steadily near 1.1000 and then falls quickly to 1.0900 during a short burst of selling. If the decline is not supported by a broader structural breakdown, buyers may perceive the lower price as attractive and sellers may take profits. Price can then recover toward the area where trading activity was previously concentrated.
Mean reversion is not guaranteed because markets also respond to genuine new information. If the decline occurred because fundamental expectations changed materially, 1.1000 may no longer represent a meaningful equilibrium. The old mean can become obsolete while a new price regime develops.
Mean Reversion vs Trend Following
The main difference between mean reversion and trend following is the assumption about persistence. A trend trader sees strong movement and looks for continuation. A mean reversion trader sees excessive movement and looks for normalization.
Suppose gold rises far above a medium-term moving average. A trend trader may interpret this as evidence of strong bullish momentum and wait for a pullback to join the advance. A mean reversion trader may consider the price stretched and look for a move back toward the average.
Both traders can be rational, but only one strategy may suit the current market regime.
During strong trends, fading extension repeatedly can create large losses. During ranges, chasing every temporary breakout can produce repeated whipsaws. This is why regime identification matters more than assuming one style is universally superior.
Statistical vs Visual Mean Reversion
The distinction between statistical vs visual mean reversion is important because a chart that looks stretched is not necessarily statistically unusual.
Visual mean reversion might use distance from a moving average or obvious range boundaries. A trader sees price far above the 20 EMA and assumes it is extended.
Statistical mean reversion attempts to quantify that distance using measures such as standard deviation, z-scores or historical distributions.
For example, price being 2% above an average may look extreme in one market but entirely normal in another. A statistical framework can help show whether the deviation is actually unusual relative to recent behavior.
Neither approach guarantees a profitable reversal. Statistical rarity does not prevent trends from becoming even more extreme.
Mean Reversion and Market Regimes
Mean reversion works best when price repeatedly returns toward a stable reference. This commonly occurs in ranges, balanced markets or periods where directional trends are weak.
Suppose EUR/USD spends several weeks rotating between 1.0950 and 1.1050 while the 20-period moving average remains near the center. Price repeatedly moves toward one side of the range and then returns toward the middle.
This environment naturally supports mean reversion logic.
Now imagine EUR/USD breaks above 1.1050, establishes higher highs and higher lows and the moving average begins rising steeply. The same strategy can become dangerous because the market is no longer oscillating around a stable equilibrium.
A mean reversion trader needs to recognize when the market has transitioned from balance into trend.
Mean Reversion in Sideways Markets
Sideways markets are usually the most intuitive environment for mean reversion trading. Price moves between support and resistance without establishing sustained direction.
Suppose gold repeatedly trades between 2,450 and 2,500. The midpoint near 2,475 can function as a rough equilibrium. When price approaches 2,450 and begins rejecting lower levels, a trader may look for movement back toward the middle. When price approaches 2,500 and momentum weakens, a trader may look for a decline toward the same central region.
This logic works only while the range remains intact. Once price breaks out and begins establishing acceptance outside the boundary, continuing to fade every extension can become costly.
Mean Reversion During Trends
Mean reversion can still occur inside trends, but the target and interpretation change. In an uptrend, price may repeatedly stretch above a moving average and then revert toward it without reversing the broader bullish direction.
Suppose EUR/USD is in a strong uptrend above a rising 50 EMA. Price accelerates far above the average and later pulls back toward it. The reversion is bearish in the short term but still occurs within a bullish higher-timeframe structure.
This distinction is critical. A trader expecting full trend reversal may hold the trade too long, while a trader targeting only a pullback toward the mean may exit appropriately.
Mean reversion does not always mean betting against the entire trend.
Bollinger Band Mean Reversion Strategy
A Bollinger Band mean reversion strategy uses volatility-adjusted bands around a moving average to identify potential overextension.
When price reaches or moves beyond the upper band, it is relatively high compared with the recent mean and standard deviation. When it reaches the lower band, it is relatively low.
A common mistake is treating every upper-band touch as a sell signal and every lower-band touch as a buy signal. Strong trends can remain near an outer band for long periods.
A more disciplined approach looks for a band extreme in a market that is already behaving in a mean-reverting way, then waits for evidence that price is beginning to move back toward the centerline.
Bollinger Band Example
Suppose EUR/USD trades sideways while Bollinger Bands remain relatively stable. Price repeatedly reaches the lower band and recovers toward the middle band.
Later, EUR/USD falls sharply below the lower band but quickly closes back inside it. Downside momentum weakens and nearby support remains intact.
A mean reversion trader may interpret the return inside the band as evidence that the previous downside extension was unsustainable.
The middle band can then become a potential reference target.
If EUR/USD instead continues falling while the bands expand downward and market structure turns bearish, the mean reversion assumption has failed.
Moving Average Mean Reversion
Moving averages are another common reference. A trader may examine how far price has moved from a 20 EMA, 50 SMA or another average that has historically acted as a center of recent trading.
Suppose GBP/USD repeatedly oscillates around a 20 EMA during a range. Price temporarily moves 40 pips above the average while the recent typical distance has been only 15 pips.
The move may be unusually stretched.
If price then fails to continue higher and begins returning toward the average, the setup fits mean reversion logic.
The danger comes when the average starts trending strongly. In that case, price may remain above it while the mean itself moves upward, reducing the value of fading extension.
VWAP Mean Reversion
VWAP can serve as an intraday mean because it represents the volume-weighted average price during the session.
Suppose an index trades significantly above VWAP after a rapid opening rally. Momentum weakens, price fails to maintain new highs and begins moving back toward the volume-weighted average.
A mean reversion trader may target VWAP as a natural equilibrium reference.
This approach can work particularly well during balanced sessions, but it becomes less reliable during strong trend days. On a powerful bullish day, price may remain above VWAP for the entire session without returning meaningfully toward it.
The market regime remains more important than the indicator itself.
Mean Reversion Entry Signals
Mean reversion entry signals should indicate not only that price is stretched but also that the extension is beginning to lose momentum.
A trader might look for rejection from support or resistance, divergence, a failed breakout, return inside a volatility band or a short-term structural break back toward the mean.
Suppose gold trades far above its average and reaches major resistance. Price forms a long upper rejection wick and then breaks below a short-term higher low.
The combination provides stronger mean reversion evidence than distance from the average alone.
The trader is no longer simply saying price is high; the market has started showing that upward pressure is weakening.
Overbought and Oversold Conditions
Terms such as overbought and oversold are often used in mean reversion trading, but they should not be interpreted literally. Overbought does not mean price cannot rise further, and oversold does not mean price must rebound.
An overbought reading typically means recent upward movement has been unusually strong according to the indicator's formula.
During a range, this may coincide with a useful mean reversion setup.
During a strong trend, overbought conditions can persist while price continues rising.
The market regime determines whether the signal represents exhaustion or simply strength.
Mean Reversion and RSI-Type Signals
Momentum oscillators can help show when price movement becomes unusually strong relative to recent behavior. A trader may use an extreme reading as a warning that the current move is stretched.
Suppose GBP/USD is ranging and an oscillator reaches an unusually low reading as price tests established support. Selling pressure then weakens and price begins recovering.
The indicator can support a bullish mean reversion setup.
However, the same reading during a powerful breakdown may be dangerous. If support has failed and volatility is expanding, buying solely because the oscillator is oversold can result in repeatedly entering against a developing trend.
Divergence and Mean Reversion
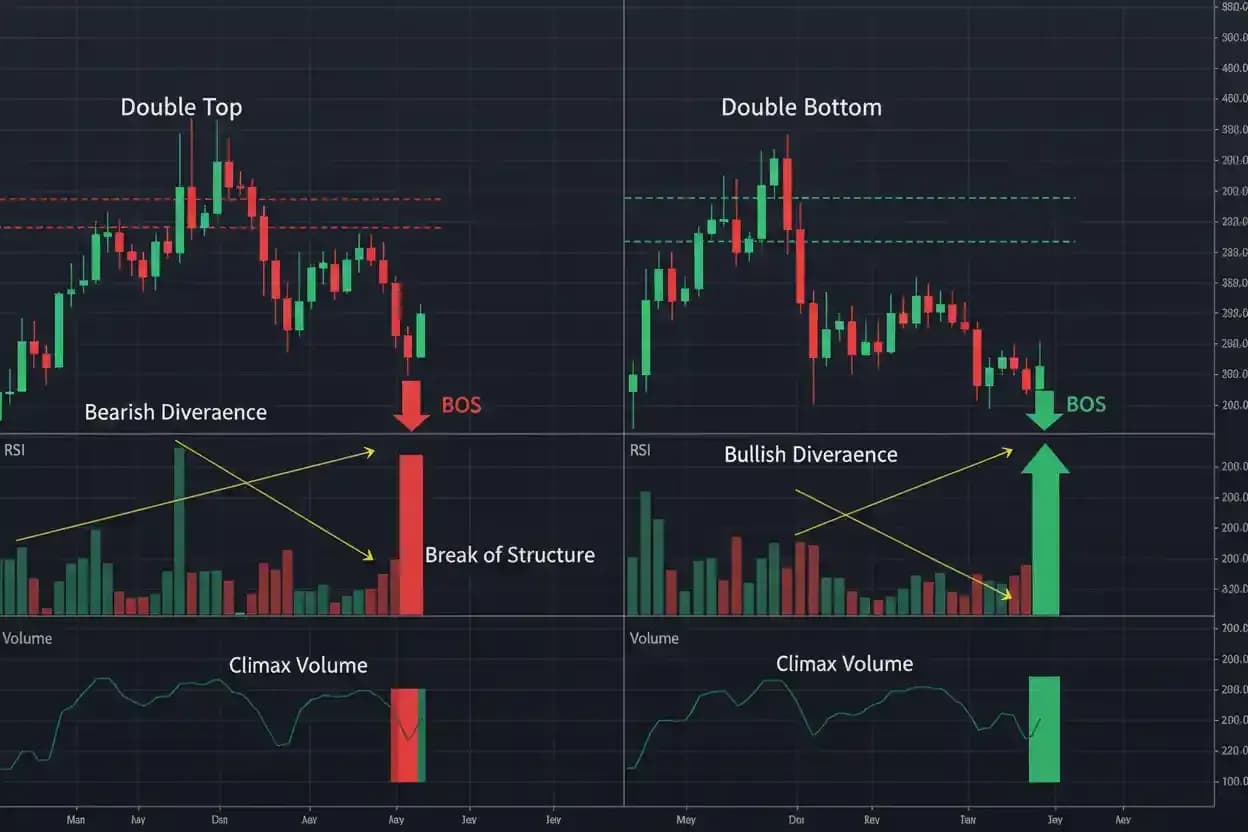
Divergence can become useful when price reaches an extreme but momentum fails to confirm it. Suppose EUR/USD makes a new low while the momentum indicator forms a higher low.
The price decline continues, but downside momentum has weakened.
A mean reversion trader may interpret this as evidence that the extension is losing force.
The trade becomes stronger if price also reaches support and begins breaking short-term bearish structure.
Divergence should remain secondary to price behavior because it can persist while the market continues moving away from the mean.
Mean Reversion and Support
Support can provide a logical location for bullish mean reversion. Suppose GBP/USD falls well below a recent moving average but reaches a major higher-timeframe support zone.
Price begins rejecting lower levels and returns above a short-term breakdown area.
The support zone provides location, while the structural recovery provides confirmation.
Buying simply because price is far below the average would be weaker because the trader has no evidence that sellers are finished.
Mean reversion is generally more robust when the deviation also reaches a technically meaningful area.
Mean Reversion and Resistance
The same logic applies to bearish setups near resistance.
Suppose EUR/USD trades substantially above its recent mean but reaches a resistance area that has produced several earlier declines.
Price attempts to break the level but fails, closes back below it and begins forming a lower high.
The extension, resistance and failed breakout collectively support a bearish mean reversion case.
The target might be the moving average, VWAP or middle of the broader range rather than a complete trend reversal.
Understanding the intended target helps keep the trade aligned with mean reversion logic.
Mean Reversion vs Reversal Trading
Reversal trading aims to identify a broader change in directional structure. Mean reversion trading often targets a more limited movement back toward equilibrium.
Suppose gold is in a long-term uptrend but becomes temporarily extended. A mean reversion trader may sell expecting a pullback toward the 20 EMA.
A reversal trader would need stronger evidence that the entire bullish structure is ending.
If gold falls to the moving average and then resumes upward, the mean reversion trade may have worked perfectly even though no major reversal occurred.
Confusing these objectives can lead traders to hold successful short-term reversion trades until they become losses.
Mean Reversion vs Breakout Trading
Breakout trading assumes movement beyond a range may expand further, while mean reversion frequently assumes an apparent break may fail and price may return to equilibrium.
These strategies can therefore take opposite sides of the same market event.
Suppose EUR/USD moves above resistance. A breakout trader buys expecting continuation. A mean reversion trader waits for evidence that the breakout is failing and may sell if price returns inside the range.
The market itself determines which interpretation is correct.
This is why traders need objective confirmation rather than entering simply because their preferred strategy expects one type of behavior.
Failed Breakouts as Mean Reversion Signals
Failed breakouts are particularly useful for mean reversion because they show that price attempted to establish a new region but could not maintain it.
Suppose gold breaks above resistance at 2,500 and reaches 2,525. The market then reverses and closes back at 2,490.
Price has returned inside the previous range.
A mean reversion trader may interpret this as evidence that the extension beyond resistance was temporary and that price could rotate back toward the range midpoint.
The setup becomes stronger if subsequent candles remain below resistance.
The failed breakout provides both location and evidence that the extreme was rejected.
Mean Reversion Volatility Filter
A mean reversion volatility filter helps traders avoid fading moves during conditions where expansion is unusually strong.
Suppose EUR/USD normally trades with moderate hourly volatility. A mean reversion strategy performs reasonably because extreme movements frequently normalize.
An important economic announcement suddenly triples normal price ranges. The market breaks several technical levels and continues trending strongly.
Using the same mean reversion thresholds from the quiet environment becomes dangerous.
A volatility filter might require ATR to remain below a certain relative level or avoid entries immediately after extreme expansion.
The objective is not to eliminate volatility but to distinguish ordinary deviations from genuine regime shifts.
Low Volatility and Mean Reversion
Mean reversion often behaves well during stable low-to-moderate volatility because price can oscillate around a relatively consistent equilibrium.
Suppose EUR/USD spends several sessions trading within a 60-pip range. Volatility remains controlled and both boundaries repeatedly hold.
A trader can reasonably evaluate stretched movement near the extremes.
However, very low volatility can also precede a breakout. If the range becomes unusually compressed, assuming that every boundary will continue holding becomes risky.
The trader should watch for signs that volatility is beginning to expand rather than treating low volatility as permanent.
Trend Strategy in Low Volatility
The trend strategy low volatility comparison helps explain why mean reversion can sometimes outperform directional strategies in quiet conditions. When movement is small and follow-through is weak, trend breakouts may repeatedly fail while price returns toward equilibrium.
This does not mean trend strategies cannot work in low volatility. A smooth, persistent trend can occur with relatively small ranges.
The more important distinction is whether price maintains directional structure or repeatedly returns toward the same central region.
Mean reversion traders should focus on actual behavior rather than assuming low volatility automatically means ranging conditions.
Mean Reversion Timeframe
The mean reversion timeframe matters because price can be stretched on one chart and completely normal on another.
Suppose EUR/USD is far above its 20-period average on a five-minute chart but remains near the middle of its daily range.
A five-minute trader may see a short-term mean reversion opportunity, while a daily trader sees no meaningful extension at all.
This does not create a contradiction. The strategies operate on different horizons.
A trader should therefore define which timeframe establishes the mean, which timeframe measures deviation and which timeframe controls the exit.
Short-Term Mean Reversion
Short-term mean reversion aims to capture relatively small movements back toward an intraday average, VWAP or recent range midpoint.
These strategies can generate frequent opportunities but are sensitive to spread, execution quality, volatility and session timing.
Suppose an index temporarily moves far above VWAP after the market open. Price loses momentum and begins rotating back toward the average.
A short-term trader may target that return.
The difficulty is that strong opening trends can remain extended for hours.
A short-term setup therefore needs clear invalidation rather than assuming every deviation must close.

Intraday Mean Reversion Strategy
An intraday mean reversion strategy generally focuses on deviations that develop and normalize within the same trading session.
A trader may use VWAP, Bollinger Bands, session range boundaries or short moving averages as references.
Suppose EUR/USD becomes stretched above its intraday mean during a quiet session, reaches resistance and then returns below a short-term support level.
The trader may target the session average.
The strategy becomes less attractive when a major catalyst has produced a genuine directional repricing. In that environment, the previous intraday mean may no longer represent equilibrium.
Forex Mean Reversion Strategy
A forex mean reversion strategy can use currency-pair ranges, session behavior, moving averages or volatility bands to identify temporary extensions.
Forex markets often oscillate during quieter periods before becoming more directional as major sessions or economic releases increase activity.
Suppose EUR/USD remains range-bound and repeatedly returns toward the center after testing either boundary. Mean reversion can fit the behavior.
If the pair later breaks the range during active London trading and begins making higher highs, continuing to sell every move above the previous mean can become costly.
The strategy should adapt when the market stops reverting.
Gold Mean Reversion Strategy
A gold mean reversion strategy can focus on temporary extensions from moving averages, volatility bands or significant price regions.
Gold often experiences sharp bursts of movement that can later partially retrace.
The challenge is that those bursts can also develop into powerful trends.
Suppose gold rises rapidly above a short-term average but approaches major resistance and begins losing momentum. A move back toward the mean may become plausible.
If the expansion is driven by a major shift in macroeconomic expectations and price keeps establishing higher highs, fading the move can be dangerous.
Gold mean reversion therefore requires especially careful attention to volatility and structural context.
Index Mean Reversion Strategy
An index mean reversion strategy often uses VWAP, opening ranges, previous session levels or short-term averages.
Indices can overextend during market opens and later rotate toward their intraday equilibrium.
Suppose a US index opens sharply lower, immediately stretches well beneath VWAP and then fails to continue making new lows. Buyers begin reclaiming short-term resistance.
A trader may look for a partial recovery toward VWAP.
The setup should not be confused with predicting a full bullish reversal. The broader market can remain bearish even while an intraday reversion trade succeeds.
Mean Reversion in Cryptocurrency Markets
Mean reversion principles can also be applied to supported cryptocurrency instruments, but high volatility makes them especially risky. Crypto prices can remain far from recent averages for extended periods during strong trends.
A move that looks statistically extreme can become even more extreme.
Traders should therefore use wider contextual filters, smaller position sizes and clear invalidation when applying mean reversion to volatile instruments.
The existence of a moving average or Bollinger Band does not place a limit on future price movement.
Trendline Breakout Strategy and Mean Reversion
A trendline breakout strategy can become relevant when a mean reversion setup begins transitioning into a larger structural move.
Suppose price has been stretched below its mean during a decline. It forms a base and eventually breaks above a descending trendline.
The break can provide confirmation that the short-term bearish pressure is weakening.
A mean reversion trader may use that event to time a move back toward the average.
If price later begins establishing higher highs and higher lows beyond the mean, the environment may be changing from simple reversion into a genuine bullish trend.
Mean Reversion and Moving Averages
Moving averages are among the simplest mean references, but traders should avoid assuming price must return to them immediately. During strong directional markets, the average itself moves toward price.
Suppose EUR/USD trends upward for several days while the 20 EMA rises steadily. Price remains above the average throughout.
A trader repeatedly shorting because price is "too far" above the EMA can lose even as the average continues following the trend upward.
The relevant question is not merely how far price is from the average, but whether the market historically reverts around that average under current conditions.
Mean Reversion and Standard Deviation
Standard deviation can quantify how unusual a deviation is relative to recent price variability.
If price sits one standard deviation from its mean, the extension is less extreme than a move three standard deviations away under the same calculation.
This can help traders distinguish ordinary fluctuation from a more unusual event.
However, standard deviation itself changes as volatility changes. During an extreme market event, the distribution can expand rapidly.
A price move that initially appears statistically rare may become part of a new volatility regime.
Statistical measures provide context, not certainty.
Mean Reversion and Z-Scores
A z-score expresses how many standard deviations a value lies from its mean. In simplified form:
Z = (Current Value − Mean) ÷ Standard Deviation
Suppose price is 102, the calculated mean is 100 and standard deviation is 1. A simplified z-score would be:
(102 − 100) ÷ 1 = 2
Price is two standard deviations above the calculated mean.
A mean reversion trader might become interested at extreme positive or negative z-scores, but the threshold should be tested for the specific market and timeframe.
A high z-score during a strong trend can remain elevated much longer than expected.
Statistical Extremes Do Not Guarantee Reversion
A statistically unusual move is not the same as a guaranteed reversal. If an unexpected economic event changes the market's underlying expectations, price can establish a new equilibrium far from the old mean.
Suppose EUR/USD historically trades around 1.1000 but a major shift in monetary expectations causes sustained repricing toward 1.1500.
A strategy repeatedly betting on a return to 1.1000 simply because that was the previous mean can accumulate large losses.
Mean reversion requires a relatively stable underlying relationship. When the regime changes, the historical mean loses relevance.
This is one of the most important risks in the strategy.
Mean Reversion Backtesting
Mean reversion backtesting can help traders determine whether a strategy historically performed under different market environments.
A useful test should examine more than total profit. The trader should evaluate average win, average loss, drawdown, losing streaks, performance during trends, performance during ranges and sensitivity to transaction costs.
Mean reversion strategies can appear attractive before costs because they may generate many small trades.
Once spreads, commissions and slippage are included, the edge can shrink considerably.
Backtesting should therefore use realistic assumptions rather than idealized entries and exits.
Mean Reversion and Transaction Costs
Frequent mean reversion trading can be particularly sensitive to transaction costs because many setups aim for relatively modest price movements.
Suppose an intraday strategy targets an average 10-pip reversion while spread and execution costs consume two pips. Twenty percent of the gross target has already been absorbed before losses are considered.
If the same strategy targets 50 pips, the relative impact of those costs is much smaller.
This is why a technically valid mean reversion idea may still be economically unattractive on very short timeframes.
The expected movement should be large enough to justify the cost of participation.
Mean Reversion and Position Sizing
Mean reversion traders should size positions according to the distance to invalidation rather than assuming price will inevitably come back.
Suppose EUR/USD is stretched below its mean and a trader buys near support. The thesis becomes invalid if price breaks 40 pips lower through the structural level.
If the trader wants to risk $100, position size should be calculated from the 40-pip distance.
Using an oversized position because price appears "extremely oversold" creates a dangerous assumption that further decline is unlikely.
Markets can remain extreme longer than a leveraged position can remain solvent.
Mean Reversion Stop-Loss Placement
Stops should reflect the point where the reversion thesis no longer makes sense.
In a bullish range setup, this may be beneath established support. In a bearish setup, it may be above meaningful resistance or the failed breakout high.
Suppose gold is expected to revert lower after rejecting resistance at 2,500. If price later closes decisively above 2,520 and maintains trading there, the assumption that resistance will contain the move may be invalid.
The trader should know this level before entry.
Moving the stop farther away after price breaks the original invalidation merely turns a failed mean reversion into an uncontrolled countertrend position.
Mean Reversion Profit Targets
The target usually relates directly to the chosen mean. This could be the moving average, VWAP, range midpoint or another equilibrium reference.
Suppose EUR/USD falls to the lower Bollinger Band during a stable range and begins recovering. The middle band may provide a reasonable first target because it represents the moving average around which the bands are constructed.
The trader does not need to assume that price will travel all the way to the opposite band.
Mean reversion often works best when the target matches the original thesis: price is expected to normalize, not necessarily begin a completely new trend.
Partial Mean Reversion
Price does not always return completely to the chosen mean. A market may revert partially and then resume its prior direction.
Suppose gold is 50 dollars above a moving average and falls 25 dollars before buyers return.
A trader targeting the full moving average may watch a meaningful profit disappear.
Some strategies therefore use partial targets, trailing exits or structural signals rather than insisting on complete reversion.
The right approach depends on historical behavior and strategy design.
The key is consistency rather than changing the target emotionally once a position is open.
Mean Reversion Trading Mistakes
Mean reversion trading mistakes often come from assuming that price must return simply because it has moved far from an average. Traders may repeatedly buy falling markets, add to losing positions as price becomes "more oversold," ignore volatility expansion, use the wrong timeframe or confuse a temporary reversion target with a full reversal. Others optimize thresholds so precisely on historical data that the strategy fails when market conditions change.
A sound mean reversion approach needs a stable market reference, a reason to believe the deviation is temporary, evidence that movement is beginning to normalize and a predefined point where the idea is wrong.
Averaging Into a Losing Position
Averaging down can be especially dangerous in mean reversion trading because the strategy naturally encourages the belief that a larger deviation creates a better opportunity.
Suppose EUR/USD falls 30 pips below its average and the trader buys. Price falls another 30 pips, so the trader doubles the position because the market appears even more oversold. Another decline follows, and exposure increases again.
If the market has entered a genuine downtrend, the strategy can create rapidly expanding losses.
A disciplined mean reversion method should define maximum exposure before entry rather than automatically increasing size as price moves farther away.
Fighting Strong Trends
The biggest strategic risk is fading genuine directional movement.
Suppose gold breaks major resistance, volatility expands and price begins making higher highs and higher lows. The market remains above a rising average for several sessions.
A trader repeatedly selling every upper-band touch is fighting a confirmed trend.
The fact that price remains extended does not make the next short trade safer.
Mean reversion traders need a mechanism for recognizing when the strategy should stand aside.
Sometimes the correct decision is accepting that the market is not currently mean-reverting.
Choosing the Wrong Mean
A reference level should make sense for the timeframe and market being traded.
Suppose a five-minute trader uses a 200-day moving average as an intraday equilibrium reference. The average may be so far removed from current short-term behavior that it provides little practical information for a brief trade.
Likewise, a swing trader using a five-minute VWAP signal to manage a multi-week position mixes incompatible horizons.
The chosen mean should correspond with the timeframe over which price is expected to normalize.
This sounds simple, but inconsistent timeframe selection is a common source of poor signals.
Overfitting Mean Reversion Thresholds
A trader may test dozens of Bollinger Band multipliers, RSI thresholds and z-score levels until one historical combination produces excellent results.
For example, a strategy using 2.17 standard deviations may appear better than 2.0 or 2.5 on one dataset.
This precision can be misleading.
The setting may simply fit historical noise.
A robust strategy should generally continue behaving reasonably across nearby parameter values and different market periods.
If a tiny parameter change destroys performance, the historical edge may not be reliable.
Ignoring Transaction Costs
Mean reversion strategies often generate many entries, particularly on lower timeframes. Small theoretical edges can disappear when spreads, commissions and slippage are added.
Suppose a backtest assumes every trade enters at the exact closing price and exits at the ideal target without cost.
Real execution will be worse.
This can turn a seemingly profitable strategy into a losing one.
Costs should therefore be treated as part of the strategy rather than as an afterthought.
Mean Reversion Trading on MetaTrader 5
Traders can use the MetaTrader 5 platform to analyze supported instruments with moving averages, volatility bands and other available tools that can support mean reversion analysis.
A clean setup might include price, one reference mean and one volatility measure.
The trader should understand what each tool contributes. Adding several moving averages, multiple oscillators and several volatility bands can make the same overextension appear to have more confirmation than it actually does.
The purpose of the chart is to identify deviation, market regime and invalidation clearly.
Mean Reversion for Traders in Pakistan
Mean reversion trading works on the same market data for traders in Pakistan as elsewhere, but session timing can affect how often prices behave in a balanced or directional way. European forex activity becomes important during Pakistan's daytime, while US markets generally become more active later.
A range that holds during a quieter period can break as participation increases during a major session.
A trader applying intraday mean reversion should therefore understand when market conditions are likely to change.
Higher-timeframe strategies are generally less dependent on exact session timing but still need awareness of major economic events that can create regime shifts.
Mean Reversion in Khyber Pakhtunkhwa
Traders in Peshawar, Mardan, Abbottabad, Swat, Kohat, Nowshera, Swabi, Haripur, Mansehra and other parts of Khyber Pakhtunkhwa can use the same mean reversion principles because the global market does not change according to trader location.
Practical considerations still matter. A very short-term mean reversion setup can require close monitoring because price can move quickly away from the expected equilibrium. Traders who cannot watch markets continuously may prefer longer timeframes where deviations and reversion develop more slowly.
The chosen method should fit available monitoring time, connectivity and personal risk tolerance rather than forcing a fast strategy into impractical conditions.
Mean Reversion Psychology
Mean reversion can feel psychologically comfortable because buying after a decline appears cheaper and selling after a rally appears logical. This comfort can become dangerous when the market is genuinely trending.
A trader may continue believing that price "has to come back" even after the original range has broken and the mean itself is moving sharply.
The strategy requires flexibility.
The trader must distinguish between a temporary deviation and a new market regime and be willing to accept when the old equilibrium no longer matters.
The objective is not to prove that price is irrational. It is to trade situations where historical behavior supports a reasonable expectation of normalization.
A Practical Bullish Mean Reversion Example
Suppose EUR/USD has traded inside a broad range between 1.0950 and 1.1050 for several sessions. The 20-period moving average remains around 1.1000, and price has repeatedly returned toward it after testing either side of the range.
EUR/USD suddenly falls to 1.0940, moving beneath both the lower range boundary and lower volatility band. Instead of continuing lower, the pair quickly closes back above 1.0950. Momentum begins improving, and price breaks above a small intraday lower high.
The market has rejected the downside extension while remaining inside the broader range structure.
A mean reversion trader may enter with a target near the 1.1000 average, while a renewed breakdown below the rejection low would invalidate the setup.
A Practical Bearish Mean Reversion Example
Suppose GBP/USD has been ranging between 1.2700 and 1.2900 with an average near 1.2800. Price rallies quickly to 1.2920 but fails to maintain the breakout. The candle closes back below 1.2900, and the next recovery forms a lower high.
The attempted breakout has been rejected.
A trader may interpret the move above 1.2900 as temporary overextension and look for price to return toward the middle of the range near 1.2800.
If GBP/USD instead recovers above 1.2920 and begins holding there, the mean reversion setup has failed because the market may be establishing a new bullish regime.
A Practical Bollinger Band Example
Suppose gold has been trading sideways and repeatedly returning toward its 20-period average. The Bollinger Bands remain relatively stable.
Gold suddenly drops below the lower band near support. The candle closes back inside the band, and the following period forms a higher low.
A trader may use the middle band as a reversion target.
The important evidence is not simply that price touched the outer band. The market was already mean-reverting, support remained relevant and price showed actual rejection of the extension.
If the bands instead begin expanding sharply downward while gold continues making new lows, the strategy should stand aside.
A Practical Failed Mean Reversion Example
Suppose EUR/USD is trading above its upper Bollinger Band and appears overextended. A trader sells expecting price to return to the mean.
Instead, EUR/USD breaks major resistance, volatility expands and price continues forming higher highs and higher lows. The moving average begins rising rapidly beneath price.
The market has transitioned from extension into sustained trend.
A disciplined trader exits when the structural invalidation occurs.
An undisciplined trader adds more short positions because each new high looks even more overbought.
This example captures the central danger of mean reversion trading: an extreme can become the beginning of a new regime rather than the end of a move.
Building a Mean Reversion Trading Routine
A practical mean reversion routine begins by confirming that the market has recently behaved in a way that repeatedly returns toward a stable reference. Identify the mean and make sure it suits the timeframe being traded. Measure whether the current deviation is unusual relative to normal volatility, then look for supporting evidence such as major support or resistance, failed breakout behavior, momentum loss or a short-term structural shift back toward equilibrium. Before entering, define where the market would demonstrate that a genuine trend or regime change is occurring instead of a temporary extension. Position size should be calculated from that invalidation distance, and the target should reflect the actual mean-reversion thesis rather than automatically assuming a complete reversal.
A concise checklist can keep the strategy focused:
- Confirm that current conditions genuinely favor reversion rather than strong trend continuation.
- Use a mean appropriate to the chosen timeframe.
- Wait for evidence that the extension is weakening.
- Define invalidation before entering.
- Avoid adding risk simply because price moves farther from the mean.
Mean Reversion Trading FAQs
What is mean reversion trading?
Mean reversion trading is a strategy that attempts to capture movement back toward a reference average or equilibrium after price becomes unusually extended.
What can be used as the mean?
Moving averages, VWAP, range midpoints, statistical averages and other equilibrium measures can all serve as references.
Is mean reversion the same as reversal trading?
No. Mean reversion often targets a partial return toward equilibrium, while reversal trading generally seeks a broader directional change.
Is mean reversion the opposite of trend trading?
The approaches often have opposite assumptions. Trend trading expects directional persistence, while mean reversion expects excessive movement to normalize.
When does mean reversion work best?
It is generally more suitable when price repeatedly rotates around a stable reference and less suitable during powerful trends.
Can mean reversion work in trending markets?
Yes, but the reversion may be only a temporary pullback toward the trend mean rather than a complete reversal.
What is Bollinger Band mean reversion?
It uses deviations from volatility-adjusted bands to identify potential movement back toward the middle band or another equilibrium.
Does touching the upper Bollinger Band mean sell?
No. Strong uptrends can remain near the upper band for extended periods.
Does touching the lower band mean buy?
No. Strong declines can continue along or beyond the lower band.
Can moving averages be used for mean reversion?
Yes. Traders often measure how far price has moved from an average and whether it begins returning toward it.
What is VWAP mean reversion?
It is an intraday approach that looks for price stretched away from VWAP to rotate back toward the volume-weighted session average.
What is a z-score?
A z-score measures how many standard deviations a value lies above or below its calculated mean.
Does an extreme z-score guarantee reversion?
No. Extreme readings can become even more extreme during strong trends or regime changes.
What is a volatility filter?
A volatility filter helps distinguish normal deviations from conditions where expansion is strong enough that fading the move may be especially risky.
Can failed breakouts create mean reversion opportunities?
Yes. When price breaks a boundary but quickly returns inside the previous range, it may revert toward the range mean.
Is RSI useful for mean reversion?
Momentum oscillators can help identify unusually stretched conditions, but extreme readings alone do not guarantee reversal.
Can divergence help mean reversion trading?
Yes. Divergence can indicate weakening momentum, especially when combined with support, resistance and structural confirmation.
What is intraday mean reversion?
It attempts to capture temporary deviations that normalize within the same trading session.
Is mean reversion suitable for forex?
Yes. Currency pairs can produce mean-reverting ranges as well as trends, so market regime matters.
Can mean reversion be used for gold?
Yes, though gold can form powerful trends that make fading extensions risky.
Can mean reversion be used for indices?
Yes. VWAP and session-range reversion are commonly applied to index markets.
Can mean reversion be used for cryptocurrency markets?
Yes, but high volatility can cause extreme deviations to persist or expand significantly.
Which timeframe is best for mean reversion?
There is no universal best timeframe. The mean and deviation measurement should correspond with the intended trading horizon.
Why does mean reversion fail during trends?
Because price can move persistently away from the old equilibrium while the reference mean itself shifts in the direction of the trend.
Should I average down in mean reversion trades?
Automatically adding exposure as price moves farther against the position can dramatically increase risk if the market has entered a genuine trend.
How should mean reversion stops be placed?
Stops should generally sit where the original assumption of temporary deviation is invalidated by structural or volatility evidence.
How are mean reversion targets chosen?
Targets may use the moving average, VWAP, middle of a range or another reference level that represents equilibrium.
Do transaction costs matter?
Yes. Frequent short-term mean reversion strategies can be highly sensitive to spreads, commissions and slippage.
Does mean reversion work differently in Pakistan?
No. The underlying market behavior is the same, though international session timing affects when intraday volatility and trends become stronger.
Is mean reversion different for traders in KPK?
No. Traders in Peshawar, Mardan, Abbottabad, Swat and other KPK locations can apply the same principles; practical monitoring conditions mainly affect timeframe selection.
Can mean reversion trading guarantee profits?
No. Markets can establish new trends instead of returning to the previous mean.
Disclaimer: Mean reversion can fail when markets establish a new trend, and leverage can magnify losses. This article is educational only, not personalized trading or financial advice.

Trade forex, gold, and indices with Medatiq Markets
Enjoy tight spreads and fast execution, built for market condition.