Reversal Trading: Strategies, Signals & Confirmation

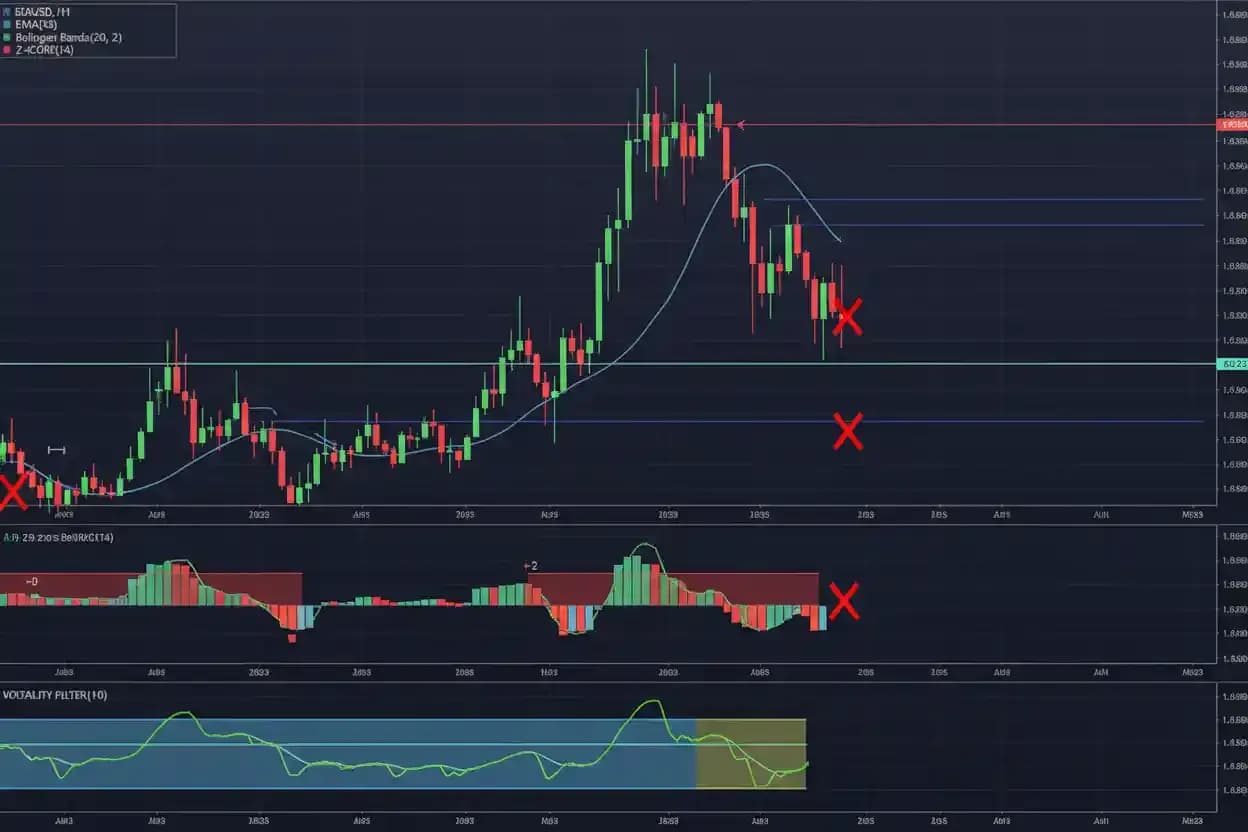
Reversal trading is a strategy built around identifying conditions in which an existing market trend may be ending and a new directional move may be beginning. Instead of entering with an established uptrend or downtrend, a reversal trader looks for evidence that the forces maintaining that trend are weakening and that the opposite side of the market is gaining control. This can involve failed attempts to make new highs or lows, momentum divergence, exhaustion, rejection from important support or resistance, candlestick changes, unusually high participation, double tops, double bottoms or a meaningful break in market structure. The difficulty is that a market can look exhausted for a long time and still continue in the original direction. Strong trends frequently produce temporary pauses, deep pullbacks and apparent divergences without actually reversing. Effective reversal trading therefore requires more than calling a top because price has risen sharply or buying a decline because the market appears cheap. The trader needs evidence that the previous directional structure is deteriorating, confirmation that opposite pressure is developing and a clearly defined point where the reversal thesis becomes invalid.
This makes reversal trading fundamentally different from trend trading, where the objective is to participate with an established directional move. It also differs from breakout trading, although an eventual breakout through an important structural level can become one of the strongest forms of reversal confirmation. A reversal trader is not simply trading against a trend; the goal is to identify a transition from one market regime to another.
What Is Reversal Trading?
Reversal trading attempts to capture a meaningful change in market direction. In an uptrend, the trader looks for evidence that buyers are losing control and sellers are beginning to establish lower prices. In a downtrend, the trader watches for signs that sellers can no longer extend the decline and that buyers are gaining enough strength to change the previous sequence of lower highs and lower lows.
Suppose EUR/USD has been rising from 1.0800 through 1.1000 and eventually reaches 1.1200. Price then struggles to extend higher, rejects the area several times and later breaks below a meaningful higher low at 1.1100. A subsequent recovery reaches only 1.1160 before sellers return. The market has moved from a sequence of higher highs and higher lows toward a lower high and structural support break. This provides much stronger reversal evidence than simply noticing that EUR/USD looked overextended at 1.1200.
A reversal therefore becomes more credible as price structure changes. The trader may identify early warning signals before that point, but confirmation matters because a weakening trend is not automatically a reversed trend.
Reversal Trading Is Not the Same as Countertrend Trading
Reversal and countertrend strategies are related but not identical. A countertrend trade can simply attempt to capture a temporary move against the larger trend, while reversal trading generally seeks a more meaningful directional change.
Imagine gold is in a strong daily uptrend but becomes overextended on a 15-minute chart. A trader may sell for a short pullback while fully accepting that the larger trend remains bullish. This is countertrend trading.
If the trader instead believes that the broader uptrend is ending and gold is beginning a sustained decline, the setup requires stronger evidence. The countertrend trading strategy therefore has a different objective from a full reversal approach even though both can involve trading against recent direction.
Understanding this distinction prevents traders from turning a short-term corrective trade into an unsupported prediction that the entire trend has ended.
Why Reversal Trading Is Difficult
Reversal trading is difficult because established trends can persist far longer than traders expect. A market may appear expensive, oversold, overbought or exhausted while continuing in the same direction for many additional periods. Momentum divergence can develop without immediate reversal, support can temporarily slow a decline without ending it, and a bearish candle can appear inside a powerful uptrend before price reaches another new high.
The trader is therefore working against the most recently established directional evidence. This creates an inherent timing challenge. Enter too early and the existing trend may continue strongly. Wait too long and much of the reversal may already have occurred.
The solution is not to find a perfect indicator. It is to define what evidence is required before the setup becomes actionable and accept that the earliest possible entry and the strongest possible confirmation cannot usually be obtained at the same time.
Trend Exhaustion vs Actual Reversal
Trend exhaustion describes a loss of strength in the existing move. A reversal describes a more meaningful change in direction. The two concepts are related, but exhaustion can occur without a full reversal.
Suppose GBP/USD has been rising. The candles become smaller, momentum weakens and price begins moving sideways. These changes may indicate exhaustion.
The market could then fall sharply, creating a reversal. It could also consolidate for several days and eventually continue upward.
A reversal trader should therefore avoid assuming that weakening momentum alone is sufficient. Price must eventually show evidence that the opposing side can actually change structure.
This is why confirmation through support breaks, resistance breaks, lower highs, higher lows or failed continuation attempts is so important.
Market Structure and Reversals
Market structure provides one of the clearest ways to evaluate reversals. An uptrend generally contains higher highs and higher lows. A downtrend contains lower highs and lower lows. A genuine reversal requires that this sequence begin changing.
Suppose EUR/USD is trending upward and forms a high at 1.1200. The latest important higher low is 1.1100. Price fails to establish another meaningful high and then falls below 1.1100. This break does not automatically create a complete downtrend, but it damages the bullish structure.
EUR/USD later rebounds to 1.1160 and fails below 1.1200, creating a lower high. Sellers then push price to 1.1030, establishing a lower low.
The combination now shows a far more convincing bearish transition: failed continuation, support break, lower high and lower low.
Early Reversal Signal vs Confirmed Reversal
An early reversal signal appears before a complete structural transition. Divergence, rejection candles, climax volume and repeated failure at resistance can all serve as early warnings.
Confirmation comes when price itself begins validating the new direction.
For example, gold may form bearish momentum divergence while making a new high. That is an early warning. Gold then forms a strong bearish rejection candle. The evidence increases. If price subsequently breaks an important higher low and a recovery forms a lower high, the reversal thesis becomes considerably stronger.
The earlier the trader enters, the better the potential price but the weaker the confirmation. Waiting creates stronger evidence but usually means accepting a later entry.
A reversal strategy should deliberately choose where it sits on this trade-off.
Reversal Trading at Support
Major support can become a logical location for bullish reversal analysis because it represents an area where buyers previously became active.
Suppose GBP/USD has been falling and approaches 1.2500, where several earlier declines stopped. Price briefly trades below the level but recovers strongly and closes back above it.
The rejection suggests that sellers could not maintain lower prices.
This alone does not establish a new uptrend. A cautious reversal trader may then watch whether GBP/USD breaks above the latest lower high. If it does, the market has begun changing the previous bearish structure.
Support provides the location, while subsequent price action provides confirmation.
Reversal Trading at Resistance
Resistance provides similar context for bearish reversals. Suppose EUR/USD has risen steadily toward a major previous high around 1.1200. Price tests the region several times but cannot maintain trading above it.
A final attempt reaches 1.1220 before closing sharply lower. The market then breaks short-term support.
The rejection shows that higher prices were not accepted, while the support break indicates that sellers are gaining structural control.
Selling simply because price reached 1.1200 would have been an anticipation trade. Waiting for rejection and structural change provides greater confirmation.
Neither approach guarantees success, but they involve different levels of uncertainty.
Candlestick Reversal Strategy
A candlestick reversal strategy uses formations such as engulfing candles, hammers, shooting-star-like rejection candles or doji structures to identify potential shifts in buying and selling pressure.
The location of the pattern matters more than its name. A bearish engulfing candle forming randomly in the middle of a range may contain little useful information. The same formation appearing after an extended uptrend directly at major resistance can become more meaningful.
Suppose gold reaches long-term resistance and forms a large bearish engulfing candle. A trader may treat this as an early reversal signal but wait for price to break nearby support before entering.
The candlestick identifies a change in immediate pressure. The structural break helps confirm that the change is affecting more than one isolated period.
Bullish Candlestick Reversals
Bullish reversal candles typically become interesting after a decline, especially when they form at technically relevant support. A long lower wick can show that sellers pushed price down but failed to maintain the lower levels. A bullish engulfing candle can show that buying pressure has overwhelmed the previous bearish body.
Suppose EUR/USD reaches support at 1.0900 after several days of selling. Price trades to 1.0875 but recovers and closes at 1.0920 with a strong lower rejection. The next candle closes above a short-term lower high.
The rejection and structural improvement together provide more evidence than either signal alone.
If EUR/USD instead falls below 1.0875 immediately afterward, the bullish reversal setup has failed.
Bearish Candlestick Reversals
A bearish reversal candle is most useful when it appears after an advance near important resistance. A long upper wick, bearish engulfing pattern or multi-candle reversal can show that buyers failed to maintain higher prices.
Suppose GBP/USD reaches 1.3000 after an extended rally. Price briefly trades to 1.3030 but closes at 1.2970, leaving a long upper wick. The following candle closes below 1.2930 and breaks nearby support.
The first candle warned that higher prices were rejected. The second provided stronger bearish confirmation.
A reversal trader can then define invalidation above the rejected high rather than selling simply because the market "looked high."
Divergence Reversal Strategy
A divergence reversal strategy compares price with a momentum or participation indicator to identify situations where new price extremes are not being confirmed by the indicator.
Suppose EUR/USD makes a higher high while a momentum oscillator forms a lower high. Price continues upward, but measured momentum has weakened.
This bearish divergence can warn that the trend is losing force.
The critical limitation is that divergence can persist for a long time. EUR/USD may continue making new highs while momentum remains weaker.
A disciplined reversal trader therefore uses divergence as supporting evidence rather than assuming that the first disagreement between price and an oscillator marks the exact top.
Bullish Divergence
Bullish divergence occurs when price creates a lower low while the chosen indicator forms a higher low. The price trend remains bearish, but the measured downside momentum is weakening.
Suppose GBP/USD falls from 1.2700 to 1.2600 and later reaches a new low at 1.2550. An oscillator that reached -80 during the first decline reaches only -60 during the second.
The indicator suggests weaker downside momentum.
If GBP/USD then breaks above an important lower high, the reversal case strengthens because price begins confirming the divergence.
If the pair continues making lower lows, the divergence was premature.
Bearish Divergence
Bearish divergence occurs when price makes a higher high while the indicator fails to do the same.
Suppose gold moves from 2,500 to 2,550 and later reaches 2,580. The momentum indicator peaks strongly during the first advance but creates a lower peak during the second.
This suggests that the new price high was achieved with weaker measured momentum.
A trader may become more cautious about buying the trend, but immediately shorting remains risky.
The reversal case becomes more convincing if gold subsequently breaks structural support and forms a lower high.
Divergence warns; price confirms.
Climax Volume Reversal
A climax volume reversal focuses on unusually high market participation near the end of an extended move. The concept is based on the possibility that a dramatic final burst of buying or selling can occur as late participants enter and existing traders exit.
Suppose an index has declined sharply for several sessions. The final selloff produces exceptionally high volume, a very wide range and a strong recovery from the low before the session closes. This can suggest that aggressive selling was met by substantial buying interest.
The volume spike alone does not prove that the decline has ended. High participation can also appear during continuation.
What matters is the subsequent response. If the index begins holding above the low and later breaks bearish structure, the climax becomes more meaningful as part of the reversal.
Selling Climax
A selling climax can occur near the end of a sharp decline when intense liquidation produces unusually large downward movement and participation. Price may temporarily accelerate as traders exit under pressure.
A possible reversal develops when that selling fails to sustain lower prices and buyers begin absorbing the activity.
Suppose gold falls aggressively through support but then recovers most of the decline during the same session. Volume is unusually high, and the next period holds above the extreme low.
This creates a potential exhaustion setup.
A trader may still wait for a break above a meaningful lower high before concluding that the bearish trend has actually reversed.
Buying Climax
A buying climax represents the opposite situation. Price rises rapidly after an extended advance while participation becomes unusually strong. Late buyers may enter because the trend appears obvious, while earlier participants begin reducing positions.
Suppose an index reaches a record high after several large bullish sessions. Volume spikes dramatically, but the market fails to maintain the new high and closes weakly.
This can indicate that demand is no longer overwhelming supply as easily as before.
A buying climax remains only a warning until price confirms the change through support failure or bearish structural development.
Double Bottom Reversal Strategy
A double bottom reversal strategy looks for two meaningful lows around a similar support area, followed by evidence that buyers are gaining control.
Suppose EUR/USD falls to 1.0900, rebounds to 1.1000 and later returns to 1.0890. The pair rejects the second low and begins rising.
The two bottoms show repeated inability to establish sustained trading below the support area.
The key confirmation level is often the intervening high around 1.1000. If EUR/USD breaks above it, the market has not only defended support twice but also overcome the resistance separating the two lows.
This structural change is more important than whether the two bottoms are visually identical.
Why Double Bottoms Fail
A double bottom can fail when the second reaction attracts only temporary buying pressure and the broader bearish trend remains intact.
Suppose GBP/USD forms two lows around 1.2500 and begins recovering. Traders assume the reversal is complete before price has broken meaningful resistance.
The recovery stalls at 1.2580, well below the major lower high, and sellers return. GBP/USD later falls through 1.2500.
The mistake was treating repeated support as proof of a completed reversal.
A double bottom creates potential. The breakout through the intervening resistance provides stronger confirmation.
Double Top Reversal Strategy
A double top reversal strategy follows the opposite logic. Price reaches a resistance area, declines, later returns to approximately the same area and fails again.
Suppose gold reaches 2,550, pulls back to 2,500 and then rallies to 2,558 before reversing. The market has tested roughly the same resistance region twice.
The reaction low around 2,500 becomes important.
If gold falls below it, the market has both failed at resistance and broken the support separating the peaks.
That combination creates more credible bearish reversal evidence than simply seeing two similar highs.
Head-and-Shoulders Reversal Logic
Although reversal trading includes many setups, the logic behind head-and-shoulders structures illustrates an important principle. An uptrend initially produces a high, then a higher high, but the next major rally fails to match the previous peak. Price subsequently breaks support connecting the intervening reaction lows.
The key information is not the visual resemblance to shoulders and a head. It is the structural transition from strong higher highs toward a weaker rally and support failure.
A reversal trader can use this logic even when the pattern is not geometrically perfect.
The objective is to recognize deterioration in trend quality followed by evidence that the opposing side has gained control.
Exhaustion Gap Reversal
An exhaustion gap reversal can occur when an already extended market gaps strongly in the direction of the trend but fails to sustain the move. This concept is more relevant in markets where meaningful session gaps occur, such as many equities and index-related instruments.
Suppose an index has risen significantly and then opens far above the previous session after widespread enthusiasm. Instead of continuing higher, price quickly reverses and closes much of the gap.
The failed extension can suggest that the final burst of buying was not sustainable.
A gap by itself does not prove exhaustion. The interpretation becomes stronger if subsequent sessions break structural support and establish lower highs.
Reversal Confirmation
Confirmation is the process of requiring additional market evidence after the first reversal warning appears. A trader may observe divergence, resistance rejection or climax volume but wait until price breaks an important structural level before entering.
Confirmation sacrifices some entry price in exchange for greater evidence.
Suppose EUR/USD reaches resistance and forms bearish divergence. Selling immediately provides an early entry with a tight invalidation above the high. Waiting until EUR/USD breaks a major higher low creates stronger evidence but results in a lower entry.
Neither method is universally superior.
The correct choice depends on the trader's strategy, acceptable false-signal rate and risk structure.

Break of Structure as Reversal Confirmation
A structural break is one of the most useful ways to confirm that a trend may be changing.
Suppose gold is in an uptrend. The latest meaningful higher low is 2,500. Gold forms a new high at 2,560 but then falls below 2,500.
The previous bullish sequence has been damaged.
If the next recovery fails around 2,530 and gold later forms a new lower low, the bearish transition becomes more convincing.
The structural break does not guarantee a sustained downtrend, but it demonstrates that the market has done something it was not doing during the previous trend.
Retest After a Reversal Break
After breaking an important structural level, price sometimes returns to retest it from the opposite side.
Suppose EUR/USD breaks below support at 1.1100 during a potential bearish reversal. Price falls to 1.1030 and later rebounds.
The recovery reaches 1.1100 but stalls, and sellers return.
The old support is now behaving as resistance.
This retest can offer a clearer bearish entry than selling during the initial support break because the trader can define invalidation around the failed recovery.
A retest is not mandatory. Strong reversals can continue without returning to the broken level.
Failed Reversal Setup
A failed reversal setup occurs when the market initially shows signs of changing direction but then resumes the original trend.
Suppose EUR/USD is in an uptrend and forms bearish divergence near resistance. A bearish engulfing candle develops and price briefly breaks short-term support. Traders enter short.
EUR/USD then recovers, breaks above the previous high and resumes its uptrend.
The reversal setup has failed.
This is not unusual. Trend continuation remains possible until the opposing structure becomes established.
A reversal trader should define failure before entry so that the original position is not repeatedly justified after the evidence has changed.
What a Failed Reversal Can Reveal
A failed reversal can itself become useful information because it shows that the original trend survived a serious challenge.
Suppose gold forms what appears to be a double top. Price begins declining but never breaks the important neckline. Buyers return and gold eventually breaks above both previous highs.
The failure of the bearish pattern demonstrates that resistance was overcome despite multiple rejection attempts.
A trend trader may view this as renewed bullish evidence.
The reversal trader should simply accept that the setup did not confirm rather than continuing to predict a top.
The goal is to interpret market behavior, not defend an opinion.
Reversal Trading vs Mean Reversion
Mean reversion trading assumes that price has moved away from a reference value and may move back toward it. Reversal trading seeks a broader change in directional structure.
These can overlap but are not identical.
Suppose EUR/USD trades far above a moving average. A mean-reversion trader may sell expecting price to return toward the average even while the larger uptrend remains intact.
A reversal trader would generally need evidence that the entire bullish structure is deteriorating.
The mean-reversion position might therefore target only a normal correction, while the reversal trade seeks a more sustained bearish movement.
Confusing the two approaches can cause a trader to hold a profitable short-term correction far too long while waiting for a major trend reversal that never develops.
Volatility Filters for Reversal Trading
Volatility strongly affects reversal behavior. A rejection that appears significant during quiet conditions can represent ordinary noise during an extremely active session.
The concept behind a mean reversion volatility filter is relevant because both mean-reversion and reversal setups can behave differently across volatility regimes.
During very high volatility, price can overshoot support and resistance substantially before reversing. Stops placed too close to obvious levels may therefore be vulnerable.
During low volatility, reversals may develop slowly and provide less immediate movement.
Traders should evaluate both structural invalidation and the market's normal range before deciding how much price fluctuation a setup can reasonably tolerate.
Trend Strategy in High Volatility
A trend strategy high volatility context can help reversal traders understand why countertrend signals are especially dangerous when a directional market is expanding aggressively.
Suppose gold is in a strong uptrend and daily ranges have doubled. Bearish divergence begins appearing.
Shorting solely because of divergence can be particularly risky because high-volatility trends can travel much further than expected before reversing.
A reversal trader may require stronger structural confirmation under these conditions than during a slower, mature trend.
The more powerful the existing directional movement, the more evidence should generally be required before assuming that it has ended.
Reversal Trading and Breakout Confirmation
Reversals frequently become clearer through breakouts in the opposite direction.
Suppose GBP/USD has been falling but forms a base around support. Price eventually breaks above the most important lower high.
This bullish breakout is also reversal confirmation because it violates the previous bearish structure.
The relationship between reversal and breakout trading therefore becomes important. A reversal often begins with exhaustion or rejection but becomes actionable only after price breaks a structural boundary.
The breakout changes the chart from "the trend may be weakening" to "the market has actually moved beyond a level that previously maintained the trend."
Reversal Trading and Forex Session Breakouts
A forex session breakout strategy can intersect with reversal trading when one session overturns the direction established earlier.
Suppose EUR/USD trends lower during Asian trading but reaches major higher-timeframe support. As European activity increases, the pair stops making new lows and breaks above the Asian-session high.
The session breakout can become one component of a bullish reversal setup.
The higher-timeframe support provides location, the failure to extend lower shows weakening bearish pressure, and the session breakout provides confirmation.
This combination is more informative than assuming every European-session breakout represents a reversal.
Reversal Trading and Momentum
Momentum often weakens before price structure fully reverses. A trend may continue making new highs while each successive advance becomes less forceful.
This can help reversal traders identify developing exhaustion.
Suppose EUR/USD advances to three successive highs, but the distance covered by each bullish leg becomes smaller and momentum readings decline.
The trend is still technically bullish.
If price subsequently fails to make another high and breaks a major higher low, the earlier momentum deterioration becomes meaningful supporting evidence.
Momentum is useful because it can warn before structure changes, but price remains necessary for confirmation.
Reversal Trading and Volume
Participation can add another layer of information. A reversal near an important level accompanied by unusually high activity can indicate that the market is experiencing significant disagreement or position adjustment.
Suppose an index falls sharply into support on extremely high volume but then closes well above its low. The combination may suggest that selling was absorbed by buyers.
If the next sessions maintain the recovery and eventually break bearish structure, the volume event becomes part of the bullish reversal case.
High activity alone cannot identify direction because both buyers and sellers are involved in every completed transaction.
The price response to that activity matters more than the raw volume number.
Reversal Trading and Candlestick Structure
Candlestick formations can help locate the moment when immediate pressure begins changing, but traders should avoid giving one candle too much authority.
Suppose gold reaches resistance and forms a bearish engulfing candle. The formation provides evidence that sellers controlled that particular period.
If the next candle immediately recovers and closes above the engulfing high, the reversal signal has failed.
If instead price continues lower and breaks structural support, the candle becomes part of a larger bearish transition.
Reversal trading works best when candlesticks, structure and market location tell a consistent story.
Reversal Trading in Forex
Reversal trading can be applied to forex trading, where currency pairs regularly transition between trends, ranges and new directional phases. Major support and resistance, central-bank events, changes in interest-rate expectations and session transitions can all contribute to turning points.
A forex trader may identify a prolonged EUR/USD uptrend approaching major resistance. Rather than shorting immediately, the trader watches for weakening momentum, rejection and a break below an important higher low.
This sequence helps avoid repeatedly selling into an uptrend simply because the market has risen substantially.
Forex reversals can also occur quickly around economic announcements, which makes stop placement and exposure especially important.
Reversal Trading in Gold
Gold can produce powerful trend reversals because macroeconomic expectations can change quickly. A market that has risen steadily for several weeks can reverse sharply when interest-rate expectations, currency conditions or geopolitical sentiment shift.
Technically, gold often provides strong rejection candles and large structural breaks during these transitions.
The same volatility that creates reversal opportunities also increases risk.
A long upper wick of $20 might look dramatic during quiet conditions but be ordinary when daily ranges are exceptionally large.
Gold reversal signals should therefore be interpreted relative to current volatility rather than using fixed dollar thresholds.
Reversal Trading in Indices
Indices can reverse around major technical levels, market openings, macroeconomic releases and shifts in broader investor sentiment. An index may open strongly, fail to maintain a breakout and reverse through its opening range.
The high participation around major exchange opens can make reversal movement develop quickly.
For traders in Pakistan, the most active US index period generally occurs later in the local day, so short-term reversal trading can require evening monitoring.
A trader unable to follow these movements continuously may find higher-timeframe reversal structures more practical than very short-term entries.
Reversal Trading in Cryptocurrency Markets
Reversal concepts can also be applied to supported cryptocurrency instruments. Double tops, double bottoms, divergence, support rejection and structural breaks all appear in crypto markets.
The challenge is that cryptocurrency volatility can produce repeated apparent reversals inside larger trends.
A market can decline 10% and still remain within a broader bullish structure, or rally sharply during an ongoing bear trend.
Timeframe context is therefore essential.
A lower-timeframe reversal should not automatically be treated as a change in the larger market direction.
Forex vs Index Reversal Trading
The reversal trading forex vs indices comparison matters because market structure and active trading periods differ. Forex operates across overlapping global sessions, whereas many index instruments experience pronounced changes in participation around the underlying exchange open.
A reversal in EUR/USD may develop gradually across London and New York trading. An index reversal can sometimes occur rapidly after the market open or a major economic release.
The technical concepts remain similar, but strategy parameters such as stop distance, expected volatility and confirmation timing should reflect the instrument being traded.
One reversal rule should not be assumed to behave identically across every market.
Reversal Trading on MetaTrader 5
Traders can analyze supported instruments through the MetaTrader 5 platform, using candlestick charts, horizontal levels and available technical indicators to study potential reversals.
A reversal chart does not need to contain many tools. Price structure, support or resistance and one carefully selected momentum or participation indicator can often provide more clarity than numerous overlapping studies.
The trader should know why each tool is present.
If three oscillators all indicate divergence because they use similar price data, their agreement does not necessarily create three independent reasons to enter.
The chart should make structural change easier to see, not hide it beneath indicators.
Reversal Trading for Traders in Pakistan
Reversal trading mechanics do not change for traders in Pakistan, but market timing influences when important intraday reversals may occur. European forex activity becomes important during Pakistan's daytime, while US markets and New York trading generally become more active later.
A trader following EUR/USD may see a significant reversal develop as European participation increases. Someone trading US indices may encounter the most active reversal conditions later in the day.
Higher-timeframe setups can reduce the need for constant monitoring because structural transitions develop more slowly.
The strategy should match the trader's actual schedule rather than requiring continuous attention at inconvenient times.
Reversal Trading in Khyber Pakhtunkhwa
Traders in Peshawar, Mardan, Abbottabad, Swat, Kohat, Nowshera, Swabi, Haripur, Mansehra and other parts of Khyber Pakhtunkhwa can apply the same reversal trading principles because global market structure is unchanged by the trader's location. Practical conditions such as monitoring time and internet reliability can still influence which timeframe is sensible.
A five-minute reversal around a volatile session open can form and fail quickly. A four-hour double bottom or structural reversal generally allows more time for analysis and execution.
Choosing a timeframe that fits real conditions can be more important than selecting the most active possible strategy.
Reversal Stop-Loss Placement
Reversal stop loss placement should reflect the point where the reversal thesis becomes invalid. In a bearish setup, this may be above the rejected high that is expected to mark the turning point. In a bullish setup, it may be beneath an important low.
Suppose EUR/USD forms a bearish reversal near 1.1200 and the setup depends on the market remaining below a rejection high at 1.1220. A decisive move above that high may invalidate the trade.
The stop distance then affects position size.
A wider technical stop does not require greater monetary risk if position size is reduced accordingly.
Position Sizing for Reversal Trades
Reversal trades can fail sharply because they begin against the previously established trend. Position sizing therefore matters even when the technical setup appears compelling.
Suppose a trader is prepared to risk $100. One reversal setup requires a 25-pip stop, while another requires 70 pips because volatility is higher.
Using the same position size on both would create very different financial exposure.
The position should generally be adjusted to reflect the actual invalidation distance.
Confidence should not replace risk control. The setup that looks most obvious can still become the next failed reversal.
Reward-to-Risk in Reversal Trading
One attraction of reversal trading is the possibility of entering close to the beginning of a new directional move. If the trader identifies a genuine turning point, the potential move can be much larger than the initial risk.
However, this attractive payoff comes with a significant false-signal problem.
A trader who repeatedly attempts to call tops and bottoms can accumulate several small losses before one larger reversal develops.
The strategy therefore needs consistent stop discipline and enough potential reward to compensate for unsuccessful attempts.
A reversal with limited room before the next major support or resistance may not be attractive even if the technical signal looks strong.
Early Entries vs Confirmed Entries
An early reversal entry typically occurs near the suspected turning point before full structure has changed. This offers better price and potentially tighter risk, but the probability of entering too soon is higher.
A confirmed entry waits until the market breaks an important structural level or completes another clear reversal condition.
Suppose gold rejects resistance at 2,600. An early bearish entry might occur near 2,590 after the rejection. A confirmed entry might wait until price breaks support at 2,550.
The early trader receives a better price if correct. The confirmed trader accepts a worse price in exchange for more evidence.
Neither approach eliminates uncertainty.
Reversal Trading Psychology
Reversal trading creates a strong temptation to prove that the market is "wrong" or "too high" or "too low." Traders can become emotionally attached to calling the exact turning point because successfully identifying a top or bottom feels especially satisfying.
This mindset is dangerous.
Markets do not reverse because a trader considers the move excessive.
A disciplined reversal trader remains willing to accept that the trend may continue and exits when the setup is invalidated.
The goal is not to demonstrate superior prediction. It is to participate when evidence supports a directional transition while controlling losses when that interpretation proves incorrect.
Trying to Pick Exact Tops
Attempting to sell the exact high of an uptrend often leads to repeated premature entries. Price reaches a new high, the trader shorts, the trend continues and another short is entered at the next high.
This process can continue many times during a powerful trend.
A more robust approach waits for deterioration in the market's behavior. The trader may still enter relatively early, but the decision is based on rejection, momentum change or structural evidence rather than the belief that price has simply risen too much.
Missing the exact top is not a failure.
A reversal strategy only needs a useful portion of the subsequent move.
Trying to Pick Exact Bottoms
The same problem appears during declines. A trader sees EUR/USD fall sharply and assumes it must bounce because it looks oversold.
Price continues falling.
The trader buys again because the new price appears even cheaper.
Without structural confirmation, this becomes averaging into a falling market rather than reversal trading.
A disciplined bullish reversal approach waits for evidence that sellers are actually losing control.
That might include rejection from support, improving momentum and a break above a meaningful lower high.
The market decides when the downtrend ends, not the trader's impression that the decline is large enough.
Fighting High-Volatility Trends
Strong high-volatility trends are especially dangerous for reversal traders because movement can remain extended far beyond conventional overbought or oversold expectations.
Suppose gold is rising rapidly while ATR expands and momentum remains strong. A bearish divergence appears.
Selling immediately may place the trader against powerful price expansion.
A better reversal framework may require the market to first lose momentum, reject a major level and break important support.
The stronger the existing trend, the more dangerous it becomes to rely on one early warning signal.
Using Too Many Reversal Signals
A trader may combine RSI divergence, MACD divergence, CCI divergence, a bearish candle and another oscillator, then conclude that five independent signals confirm the reversal.
In reality, several of those indicators may be reacting to the same underlying loss of price momentum.
More signals do not automatically mean more independent evidence.
A cleaner framework can combine information from different dimensions: structural resistance, one momentum measure, a candlestick rejection and an actual price break.
This provides a clearer analytical sequence than stacking several similar oscillators.
Changing the Reversal Level After Entry
Suppose a trader shorts EUR/USD because 1.1200 is expected to mark a reversal. Price breaks 1.1200 and reaches 1.1250.
Instead of accepting invalidation, the trader decides that 1.1300 is now the "real" resistance.
Price reaches 1.1320 and the level moves again.
This behavior turns a defined trade into an unlimited prediction.
Reversal levels should be identified before entry, and the trader should know what market action proves the original thesis wrong.
A failed setup is normal. Refusing to recognize failure is a risk-management problem.
Common Reversal Trading Mistakes
Common errors include entering solely because a market appears overbought or oversold, assuming divergence guarantees a turning point, trading against strong trends without structural confirmation, increasing position size after several failed attempts and treating every rejection wick as evidence of institutional reversal. Traders may also confuse a normal pullback with a complete trend change or hold a temporary countertrend trade long after the market begins resuming its original direction.
A strong reversal framework uses a small number of meaningful conditions. Location identifies where a reversal could make sense, early signals show that the existing trend may be weakening, structural confirmation demonstrates that price is actually changing, and predefined invalidation limits the cost when the idea fails.
A Practical Bullish Reversal Example
Suppose GBP/USD has been in a downtrend, producing lower highs and lower lows. The pair falls toward major support around 1.2500 and briefly reaches 1.2470 before recovering. Momentum forms bullish divergence because the new price low is accompanied by a higher oscillator low.
The divergence is an early warning, not an entry by itself.
GBP/USD then forms a strong bullish rejection candle and rallies above the latest meaningful lower high at 1.2580. The first major structural change has occurred.
A subsequent pullback reaches 1.2540 but remains above the original low and then begins rising again, creating a higher low.
The bullish reversal case now contains support, divergence, rejection, structural break and higher-low confirmation. If price later falls below the original reversal low, the thesis is invalidated.
A Practical Bearish Reversal Example
Suppose EUR/USD has been trending upward and reaches major resistance around 1.1200. Price makes a marginal new high at 1.1220, but momentum fails to confirm it. A bearish divergence develops.
EUR/USD then forms a large upper rejection and falls below the latest important higher low at 1.1130.
The pair rebounds toward 1.1165 but fails to reach the previous high and begins declining again.
This sequence provides much stronger bearish evidence than simply shorting the first touch of 1.1200. The market has rejected resistance, lost momentum, broken bullish structure and created a lower high.
A move above the reversal high would invalidate the bearish thesis.
A Practical Double Bottom Example
Suppose gold falls to 2,450, rebounds to 2,500 and later returns to 2,445. The second low is slightly below the first, but price quickly recovers above 2,450.
Instead of assuming a double bottom is complete, the trader watches the intervening resistance around 2,500.
Gold eventually breaks above 2,500 and closes at 2,515. A later pullback holds near 2,500 before buyers return.
The structure now shows repeated support rejection, resistance breakout and successful retest.
The setup represents a more complete bullish reversal than simply buying because two lows appeared near the same region.
A Practical Failed Reversal Example
Suppose an index is in a strong uptrend and approaches resistance at 5,000. Bearish divergence appears, and a rejection candle forms at the level.
A trader expects a reversal.
Price falls slightly to 4,960 but never breaks the important higher low at 4,900. Buyers return, the index moves above 5,000 and reaches 5,080.
The reversal never confirmed.
The divergence and rejection were legitimate warning signals, but the broader bullish structure remained intact.
A disciplined trader either avoided entry while waiting for confirmation or exited when price invalidated the bearish setup.
This illustrates why reversal signals describe possibilities rather than guarantees.
Building a Reversal Trading Routine
A practical reversal process begins by identifying an established trend because a meaningful reversal requires something to reverse. The trader then looks for a technically important location such as major support or resistance and watches whether the existing trend begins losing strength. Divergence, climax volume or rejection can provide early evidence, but price should ultimately demonstrate that the opposing side is gaining control through a meaningful structural break. The trader can then choose between entering on that confirmation or waiting for a retest, while defining the exact price behavior that would invalidate the setup and adjusting position size to match the required stop.
A concise reversal checklist can keep the process disciplined:
- Identify a real prior trend and a meaningful reversal area.
- Look for exhaustion or weakening rather than guessing solely from price distance.
- Require structural confirmation appropriate to the strategy.
- Define invalidation before entering.
- Keep risk controlled because failed reversals are normal.
Reversal Trading FAQs
What is reversal trading?
Reversal trading is a strategy that attempts to identify when an existing trend is ending and a new directional move may be beginning.
Is reversal trading the same as countertrend trading?
No. Countertrend trading may target only a temporary correction, while reversal trading generally seeks a more meaningful directional change.
What is a bullish reversal?
A bullish reversal occurs when a declining market transitions toward rising structure.
What is a bearish reversal?
A bearish reversal occurs when an uptrend weakens and price begins developing bearish structure.
What confirms a reversal?
Confirmation can include a meaningful structural break, failed continuation, a lower high after an uptrend or a higher low after a downtrend.
Does divergence confirm a reversal?
Divergence can warn that momentum is weakening, but it does not confirm a reversal by itself.
What is bullish divergence?
Bullish divergence occurs when price forms a lower low while a momentum indicator forms a higher low.
What is bearish divergence?
Bearish divergence occurs when price forms a higher high while an indicator forms a lower high.
Can candlestick patterns signal reversals?
Yes. Rejection candles and engulfing patterns can provide early evidence, especially at important levels, but they can fail.
What is a climax volume reversal?
It is a potential reversal associated with unusually high participation near the end of an extended directional move.
What is a double bottom reversal?
A double bottom forms when price tests a support region twice and then begins overcoming the resistance between those lows.
What is a double top reversal?
A double top forms when price tests a resistance region twice and subsequently begins breaking the support between the peaks.
Is a double top confirmed after two highs appear?
Not necessarily. Many traders look for a break of the reaction low between the two peaks before treating the structure as confirmed.
Is a double bottom confirmed after two lows appear?
Not necessarily. A break above the intervening resistance can provide stronger confirmation.
What is an exhaustion gap?
It is a gap that appears after an extended trend and may become significant if the market cannot maintain the move and begins reversing.
Can reversal setups fail?
Yes. Failed reversals are common because established trends can pause temporarily and then resume.
What is a failed reversal?
A failed reversal occurs when early evidence suggests a trend change but price ultimately resumes the original direction.
Should I enter a reversal before confirmation?
Some strategies use early entries, while others wait for structural confirmation. Earlier entries generally provide better price but greater false-signal risk.
Is structural confirmation always better?
It provides more evidence but usually creates a later entry and may reduce available reward.
How should a reversal stop be placed?
The stop should generally reflect the price level that invalidates the reversal thesis while accounting for normal volatility.
Can reversal trading be combined with breakout trading?
Yes. A breakout through an important structural level can confirm that the previous trend is reversing.
Is reversal trading suitable for forex?
Yes. Forex pairs regularly transition between directional trends and new market structures.
Can reversal trading be used for gold?
Yes, though gold's volatility can produce sharp false reversals and requires careful position sizing.
Can reversal trading be used for indices?
Yes. Indices can create reversal opportunities around major levels, market opens and macroeconomic events.
Can reversal trading be used for cryptocurrency markets?
Yes, although high volatility can create frequent apparent reversals inside larger trends.
Which timeframe is best for reversal trading?
There is no universal best timeframe. Higher timeframes generally create broader structures, while lower timeframes provide earlier but noisier signals.
Does reversal trading work differently in Pakistan?
The market principles are unchanged. Traders in Pakistan mainly need to consider when European and US sessions become active in Pakistan Standard Time.
Is reversal trading different for traders in KPK?
No. Traders in Peshawar, Mardan, Abbottabad, Swat and elsewhere in KPK can use the same reversal concepts; local monitoring conditions mainly affect practical timeframe selection.
What is the biggest reversal trading mistake?
One of the biggest mistakes is trying to call the exact top or bottom without evidence that market structure is actually changing.
Can reversal trading guarantee profits?
No. Apparent reversals can fail, and established trends can resume unexpectedly.
Disclaimer: Reversal signals can appear before a trend truly ends, and leverage can amplify losses. This article is educational only, not personalized trading or financial advice.


Trade forex, gold, and indices with Medatiq Markets
Enjoy tight spreads and fast execution, built for market condition.