Trend Trading: Strategies, Indicators & Risk Management
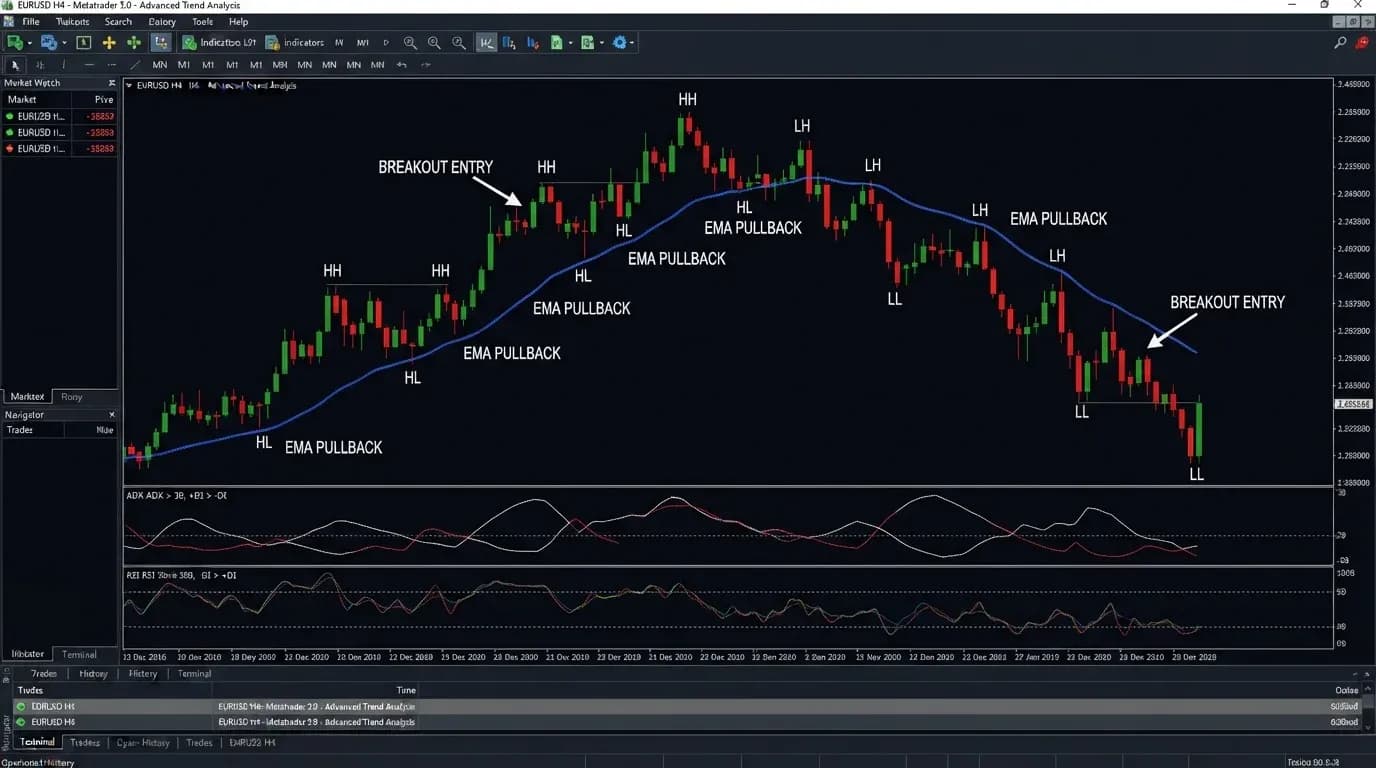
Trend trading is a strategy built around identifying sustained directional movement and attempting to participate while that movement remains structurally intact. Rather than trying to predict exact market tops and bottoms, a trend trader generally accepts that a move may already be underway before entering and focuses on whether price continues forming a recognizable sequence of higher highs and higher lows in an uptrend or lower highs and lower lows in a downtrend. The approach can be applied to forex, gold, indices and other actively traded markets across short-term and longer-term timeframes. Trend trading can use pure price structure, moving averages, ADX, Ichimoku, Donchian Channels or combinations of these tools, but no indicator can guarantee that an existing trend will continue. Every trend eventually slows, consolidates or reverses, which means entries, stop placement, position sizing and late-entry risk matter as much as identifying direction. A strong trend can produce attractive opportunities, but entering after an extended move or using excessive leverage can turn an otherwise reasonable directional idea into a poor trade.
Trend trading therefore requires more than simply buying when price is rising or selling when it is falling. The trader needs a repeatable method for determining whether a directional move is established, whether the current entry still offers acceptable risk, where the trend thesis becomes invalid and whether market conditions still suit a trend-following approach.
What Is Trend Trading?
Trend trading is a strategy that attempts to align positions with sustained market direction. A trader looking for an uptrend generally wants evidence that buyers are repeatedly able to push price to higher levels while pullbacks remain relatively controlled. In a downtrend, sellers repeatedly force price lower while recoveries fail at progressively lower levels. The objective is not necessarily to capture the entire move from beginning to end. In practice, many trend traders enter only after the trend has become visible and exit before the absolute final turning point.
Suppose EUR/USD rises from 1.0800 to 1.0900, pulls back to 1.0850, advances to 1.0980 and then forms another higher low around 1.0910. The sequence shows that buyers continue establishing higher prices while sellers have been unable to push the pair back to the earlier lows. A trend trader may interpret that structure as bullish and look for opportunities to participate during pullbacks rather than trying to sell every short-term advance.
The same reasoning works in reverse during a decline. If GBP/USD repeatedly forms lower highs and lower lows, the trader may focus on bearish continuation until the market produces enough evidence that the structure has changed.
Why Trend Trading Works as a Framework
Trend trading is based on the observation that markets can move directionally for extended periods. Economic expectations, changes in monetary policy, shifts in investor sentiment, institutional positioning and persistent demand or supply can all contribute to sustained movement. Once a trend becomes established, participants who missed the initial move may enter during pullbacks, while traders positioned against the direction may be forced to exit as price continues moving.
This process can reinforce the prevailing trend for a period of time. However, it is important not to turn this observation into the assumption that trends are permanent. Every trend exists within changing market conditions. The same forces that created the movement can weaken, reverse or become fully reflected in price.
Trend trading therefore works best as a conditional framework: remain aligned with the direction while the structure supports it, but be prepared to reduce exposure or exit when the evidence changes.
How to Identify a Trend
The most direct method is to study market structure. An uptrend generally consists of higher highs and higher lows, while a downtrend contains lower highs and lower lows. A market that repeatedly breaks in both directions without maintaining either sequence may be ranging instead of trending.
The dedicated how to identify a trend process can help traders distinguish genuine directional structure from temporary movement. This distinction matters because many trend strategies perform poorly when price is moving sideways.
Suppose gold rises sharply for two candles but remains trapped inside the same broad range that has controlled price for several weeks. The short-term rally alone does not necessarily establish a meaningful uptrend. By contrast, if gold breaks above the range, holds the breakout and begins producing a sequence of higher lows, the directional case becomes stronger.
Higher Highs and Higher Lows
An uptrend is easiest to recognize when price continues forming higher swing highs and higher swing lows. The higher highs show that buyers can push the market beyond previous resistance, while the higher lows indicate that pullbacks are being supported at progressively higher levels.
Consider a simplified sequence:
1.1000 → 1.1150 → 1.1080 → 1.1230 → 1.1160 → 1.1300
The market repeatedly advances to new highs while each meaningful pullback stops above the previous low. A trend trader may remain constructive while that sequence continues.
The trend begins to deserve more scrutiny when price fails to create a fresh high, breaks an important higher low or starts developing lower highs. The change does not guarantee a full reversal, but it indicates that the previous directional structure is no longer as clean.
Lower Highs and Lower Lows
A downtrend follows the opposite sequence. Sellers repeatedly push price below previous lows, while recoveries fail at progressively lower levels.
Suppose GBP/USD moves from 1.3000 to 1.2850, rebounds to 1.2940, declines to 1.2780 and later recovers only to 1.2870. The pair has created both a lower low and a lower high.
A trend trader may treat subsequent rallies as potential opportunities to join the existing bearish direction rather than automatically assuming each recovery marks a bottom.
The downtrend remains structurally intact until buyers begin breaking important lower highs and establishing higher lows of their own.
Trend Trading vs Reversal Trading
Trend trading attempts to participate with established directional movement, while reversal trading attempts to identify when an existing move is ending and a new one may begin.
The two approaches involve different forms of uncertainty. A trend trader risks entering after much of the move has already occurred. A reversal trader risks entering too early against a trend that remains powerful.
Suppose EUR/USD has risen for several weeks. The trend trader waits for a pullback and buys with the established direction. The reversal trader sees signs of exhaustion and sells in anticipation of a top.
Either approach can work under the right conditions, but they should not be mixed casually. A trader who enters with the trend and then converts the position into a reversal idea whenever the trade moves against them loses the clarity of both strategies.
Trend Trading vs Mean Reversion
Mean reversion trading is based on the idea that price can move away from a reference value and later return toward it. Trend trading assumes that directional movement can persist.
These approaches can therefore generate opposite signals. A market trading far above a moving average may look attractive to a trend trader because momentum remains strong, while a mean-reversion trader may see the same extension as an opportunity to trade against the move.
The difference is largely about market regime. During a strong trend, repeatedly betting on mean reversion can produce significant losses because price may remain extended for much longer than expected. During a range, trend-following entries can become vulnerable to repeated false breakouts and whipsaws.
Understanding whether the market is trending or reverting around a stable mean is more important than treating one style as universally superior. The distinction between statistical vs visual mean reversion also matters because a visually stretched chart is not automatically statistically unusual.
Trend Trading With Price Structure
Price structure is one of the cleanest trend trading methods because it does not require an indicator to tell the trader whether meaningful highs and lows are rising or falling.
Suppose EUR/USD is in an uptrend. Instead of buying at the latest high, the trader waits for a pullback. Price declines but remains above the previous important higher low. Selling pressure gradually weakens, and EUR/USD begins rising again.
The trader can then look for evidence that the pullback is ending and the larger trend is resuming.
This structure-based approach is useful because it provides a clear invalidation point. If the market breaks the higher low that was supposed to remain intact, the trend thesis needs to be reassessed.
Moving Average Trend Strategy
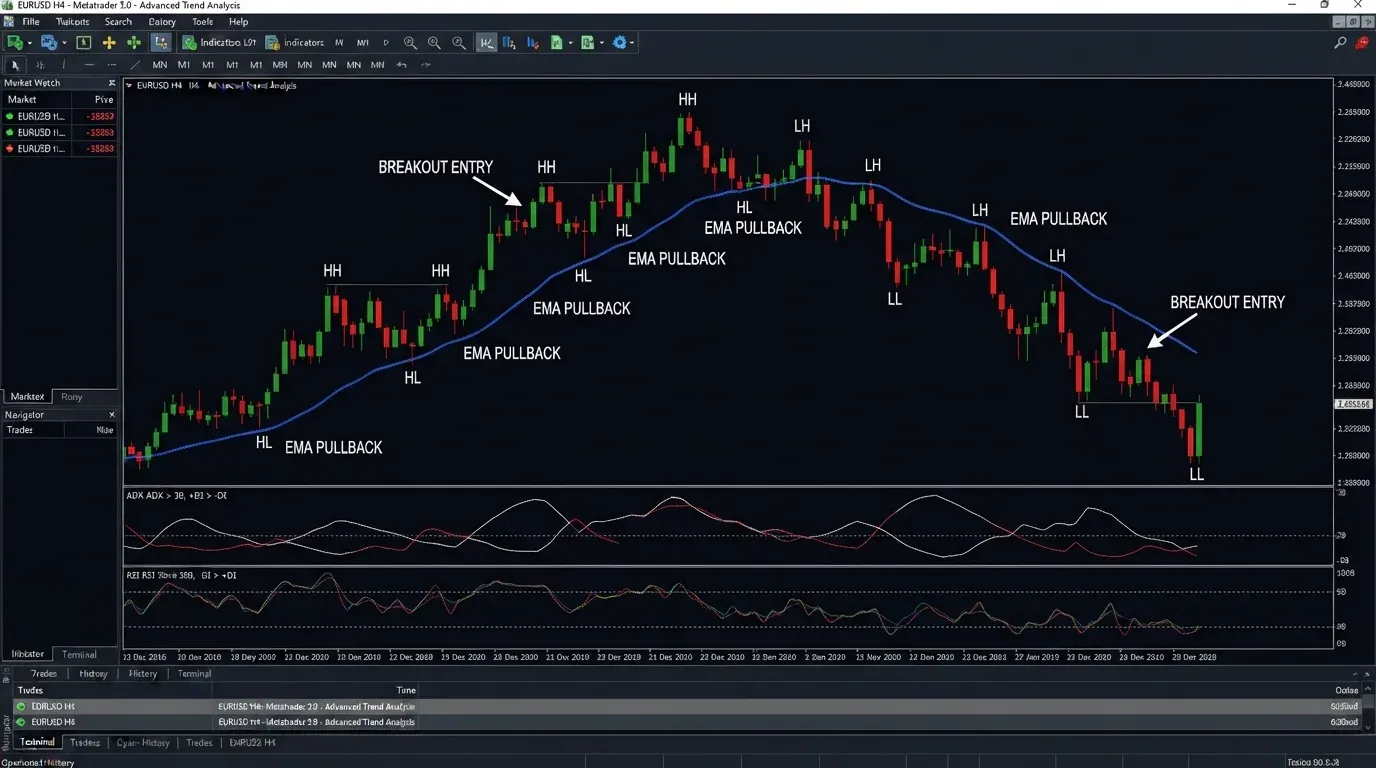
A moving average trend strategy uses one or more moving averages to help identify direction and pullback areas. A rising moving average with price consistently above it can support a bullish interpretation, while a declining average with price below it can support a bearish one.
Suppose EUR/USD remains above a rising 50-period moving average and repeatedly rebounds after approaching it. The average may become a useful trend reference.
However, the moving average itself does not cause price to reverse. The useful information comes from the market repeatedly maintaining an upward structure around the same broader region.
If EUR/USD begins closing below the average and also breaks important higher lows, the trend may be changing. Price structure should therefore remain part of the analysis rather than allowing one line to control every decision.
Fast and Slow Moving Averages
Some trend traders compare a faster moving average with a slower one. If the faster average remains above the slower average and both are rising, the alignment can support an uptrend interpretation.
A common example might compare a 20 EMA with a 50 EMA. When the faster average is above the slower one, recent prices have been stronger relative to the longer calculation.
This relationship can be useful, but traders should remember that both indicators are based on the same underlying price series. Two moving averages agreeing with each other do not create two completely independent sources of evidence.
A cleaner trend framework may combine moving averages with price structure or volatility rather than stacking many similar averages.
ADX Trend Strategy
The ADX trend strategy uses the Average Directional Index to assess whether directional movement is becoming stronger or weaker. ADX is primarily a trend-strength measure rather than a bullish or bearish indicator by itself.
Suppose EUR/USD is making higher highs and higher lows while ADX begins rising. The price chart identifies the bullish direction, while ADX suggests that the directional movement is strengthening.
Now imagine GBP/USD is making lower highs and lower lows while ADX rises. The same ADX behavior now accompanies a bearish trend.
This distinction is critical. A rising ADX does not mean buy. It means the market's directional behavior is becoming stronger according to the calculation.
When ADX Can Help Trend Traders
ADX can be particularly useful when a trader wants to distinguish directional conditions from weak or choppy markets. If price is repeatedly crossing moving averages while ADX remains low, a trend-following strategy may be vulnerable to whipsaws.
When ADX begins rising as market structure becomes clearer, the trader may have stronger evidence that a directional regime is developing.
However, waiting for a very high ADX reading can create late-entry risk. By the time trend strength looks obvious, price may already have moved a considerable distance.
ADX should therefore help describe the environment rather than become a rigid trigger used without regard to entry location.
Donchian Trend Following Strategy
A Donchian trend following strategy uses recent highest highs and lowest lows to identify breakouts and directional movement.
Suppose a 20-period Donchian Channel marks the highest high and lowest low of the previous 20 periods. If price breaks above the upper boundary, the market is reaching a new 20-period high. A trend trader can interpret this as evidence of bullish expansion.
The advantage is objectivity: the breakout level is derived directly from the lookback period.
The disadvantage is that not every new high develops into a sustainable trend. Price can briefly break the channel and return inside it.
Trend following therefore depends on accepting that some breakouts will fail while the larger successful trends need to compensate for those unsuccessful signals.
Ichimoku Trend Strategy
An Ichimoku trend strategy can combine trend direction, momentum and support or resistance relationships within one framework.
A market trading above the cloud while key Ichimoku lines support the same direction may be interpreted as broadly bullish. A market below the cloud may indicate bearish conditions.
The strength of Ichimoku is that it organizes several relationships visually.
The risk is that traders can treat the system as automatic. No cloud configuration guarantees continuation, and a sudden market event can invalidate a seemingly strong signal.
As with moving averages or ADX, Ichimoku should help define context while actual price behavior and risk remain central.
Buy the Dip Strategy
A buy the dip strategy attempts to enter an existing uptrend during temporary weakness rather than buying after price has already accelerated.
Suppose EUR/USD is making higher highs and higher lows. Instead of buying immediately after a breakout, the trader waits for a pullback toward support.
The advantage is potentially better entry location. The trader may enter closer to an invalidation point and avoid chasing an extended price.
The difficulty is knowing whether the dip is a normal correction or the beginning of a larger reversal.
A useful dip remains within the broader bullish structure. If price breaks important higher lows and begins forming lower highs, the original trend thesis may no longer be valid.
Selling Rallies in a Downtrend
The bearish equivalent involves waiting for temporary recoveries within a larger downtrend.
Suppose GBP/USD continues producing lower highs and lower lows. After a sharp decline, the pair rebounds toward previous support that has become resistance.
A trend trader may wait to see whether sellers return in that region.
This approach can provide better entry location than selling after a large bearish candle.
Again, the key distinction is whether the recovery remains corrective. If GBP/USD breaks above important lower highs and starts developing higher lows, the bearish trend structure is changing.
Breakout Trading With the Trend
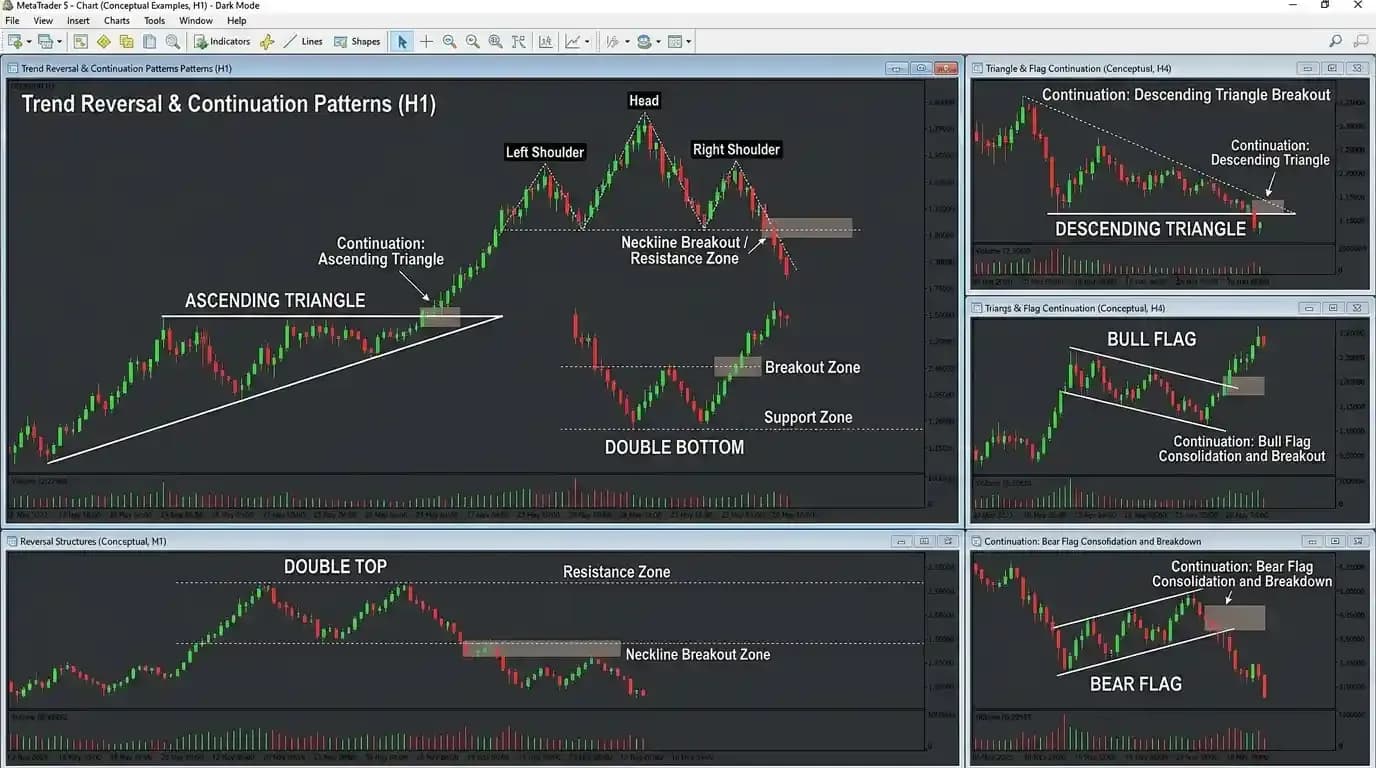
Breakout trading can complement trend strategies when price moves beyond a meaningful structural boundary in the direction of the broader trend.
Suppose an index is trending upward but spends several sessions consolidating beneath resistance. Price then breaks above the range while the broader trend remains intact.
The breakout may represent continuation.
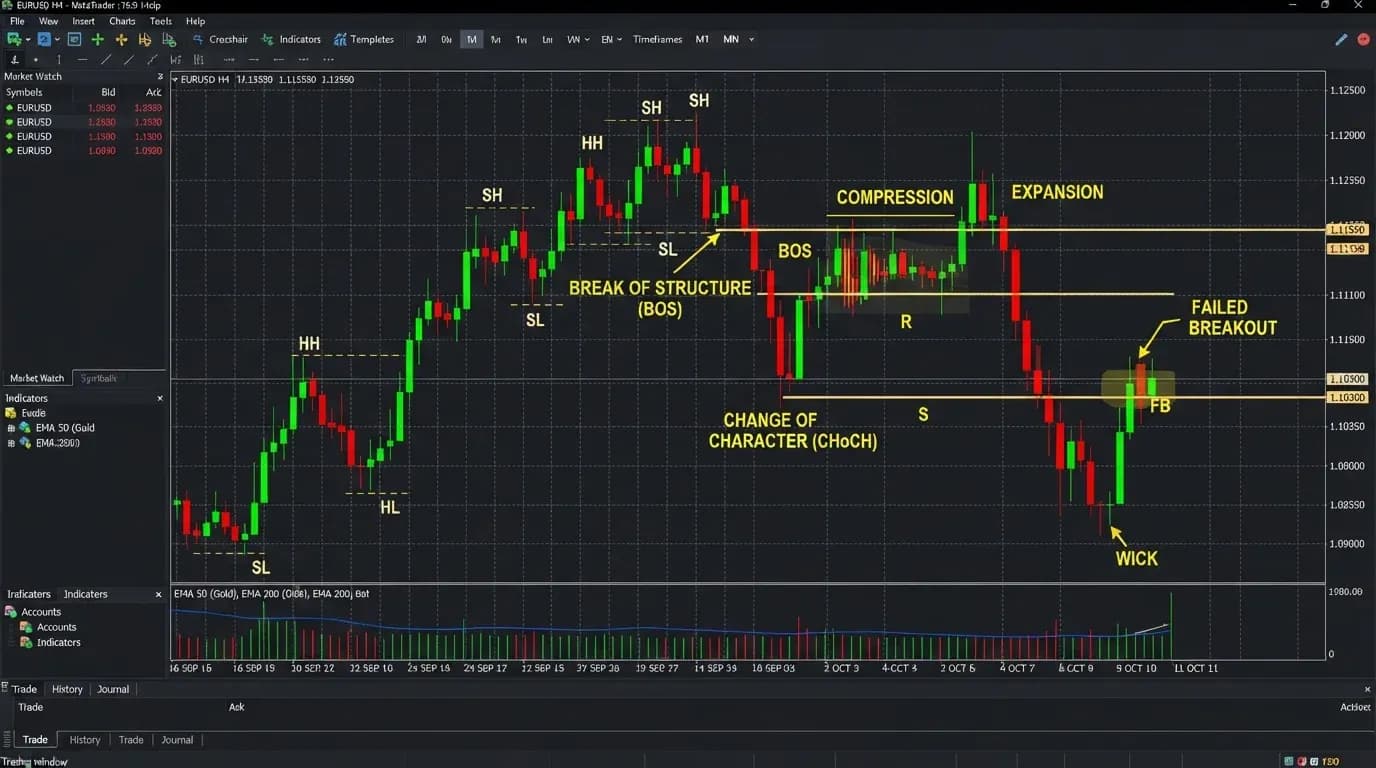
Trend traders should still distinguish between a breakout that closes firmly above resistance and one that briefly trades through the level before reversing.
The existence of an uptrend does not make every breakout successful.
Opening Range Breakout Strategy
An opening range breakout strategy focuses on the high and low established during an initial trading period after a market opens. If price breaks the range in alignment with a larger directional trend, some traders interpret that as confirmation of intraday momentum.
Suppose a US index is in a broader uptrend. The market opens, establishes an initial range and then breaks above the opening high while maintaining bullish structure.
The alignment between larger trend and intraday breakout may be more attractive than an opening-range signal taken against the broader direction.
The approach still carries false-breakout risk, particularly around volatile market opens when price can rapidly move through both sides of the initial range.
Multi-Timeframe Trend Strategy
A multi timeframe trend strategy attempts to align broader directional structure with a more precise entry timeframe.
Suppose the daily EUR/USD chart is in an uptrend. The four-hour chart shows a pullback, while the one-hour chart begins shifting back toward bullish structure.
A trader might use the daily chart to define the primary direction, the four-hour chart to locate the correction and the one-hour chart to identify when buying pressure begins returning.
This does not mean every timeframe must point upward simultaneously. During an uptrend, lower timeframes naturally turn bearish during pullbacks.
The objective is to understand how short-term movement fits inside the larger trend rather than treating every temporary decline as a reversal.
Higher-Timeframe Trend, Lower-Timeframe Entry
A common mistake is believing that higher-timeframe alignment means blindly buying every lower-timeframe signal. The higher timeframe provides context, not certainty.
Suppose gold remains bullish on the daily chart but the one-hour chart is falling sharply after breaking important intraday support. Entering simply because the daily chart is bullish may mean buying while short-term selling remains powerful.
A more patient trader can wait for lower-timeframe evidence that the correction is stabilizing.
This creates a clearer sequence: broader trend, pullback, local structural shift and entry.
The trade can still fail, but the reasoning is more coherent.
Trend Pullbacks
Pullbacks are normal within trends. An uptrend does not move higher in a straight line, and a downtrend does not fall continuously without recoveries.
These corrections allow traders to evaluate whether the trend remains healthy.
Suppose EUR/USD rises 150 pips and then pulls back 50 pips. If the correction remains above important structural support and selling pressure gradually weakens, the larger trend may remain intact.
If the pullback accelerates, breaks major support and establishes a lower high afterward, the decline is no longer behaving like an ordinary correction.
Trend trading therefore requires distinguishing temporary countertrend movement from genuine structural deterioration.
Deep vs Shallow Pullbacks
A shallow pullback shows that the dominant side remains aggressive. In an uptrend, buyers step in quickly and prevent price from retracing much of the previous advance.
A deeper pullback does not automatically mean the trend has ended, but it requires more careful analysis.
Suppose EUR/USD rises from 1.1000 to 1.1200. A pullback to 1.1160 is relatively shallow, while a decline to 1.1020 gives back most of the move.
Both can technically remain above the original low, but the second correction indicates substantially greater selling pressure.
Trend quality involves more than whether the final structural level has technically survived.
Late Trend Entry Risk
Late trend entry risk becomes increasingly important as a directional move extends.
Suppose an index has risen for several weeks. Moving averages are strongly aligned, ADX is high and the uptrend now looks obvious to almost everyone.
A trader buys simply because the trend appears strong.
The problem is that price may already be far above logical support, while the nearest technical invalidation level is far below the entry.
Even if the broader bullish trend remains intact, a normal pullback can create a significant loss.
Trend strength and entry quality are different questions.
How to Recognize an Extended Trend
No single measurement defines when a trend has gone "too far," but traders can observe the distance from recent structure, volatility, moving averages and the location of nearby support or resistance.
Suppose gold is trading far above its recent moving average after several large bullish candles. Buying at the current price may require placing the stop far below to respect structure.
The trade could still continue higher, but the reward-to-risk profile may be unattractive.
A disciplined trend trader does not need to participate in every stage of a trend.
Missing part of a move is preferable to entering without a logical risk structure.
Trend Exhaustion
Trend exhaustion describes conditions in which a directional move begins losing its previous strength. Price may continue rising while momentum weakens, pullbacks deepen or breakouts stop producing meaningful continuation.
Suppose EUR/USD makes a marginal new high but immediately falls back below the breakout level. The next rally fails to reach the same high, and price then breaks an important higher low.
The trend has shifted from clean continuation toward structural weakness.
One sign alone may not confirm a reversal, but the combination indicates that the earlier bullish environment is changing.
Trend traders should respond to deteriorating structure rather than assuming that the previous direction will eventually resume.
Trend Reversal vs Trend Pause
Not every loss of momentum produces a reversal. Markets frequently pause, consolidate and then continue in the original direction.
Suppose EUR/USD has been rising and then spends several days moving sideways. The moving average flattens slightly, ADX declines and momentum becomes neutral.
The trend has paused, but the market has not necessarily turned bearish.
If price later breaks above the consolidation, the uptrend may resume.
If support fails and lower highs begin forming, the pause may develop into a reversal.
The distinction becomes clear only through subsequent price behavior.
Trend Trading and Support and Resistance
Support and resistance can improve trend entry location.
In an uptrend, previous resistance that becomes support can create a useful pullback area. In a downtrend, broken support that becomes resistance can help define a rally entry.
Suppose EUR/USD breaks resistance at 1.1100 and reaches 1.1200. Price later returns toward 1.1100 while the broader trend remains bullish.
If buyers defend the region, the old resistance may now serve as support.
The trend provides direction, while the level provides location.
This combination is generally more useful than buying simply because a trend indicator remains bullish.
Trend Trading and Moving Average Support
A moving average can provide another dynamic reference during established trends.
Suppose an index remains above a rising 50 EMA for several months. Pullbacks repeatedly approach the average before buyers return.
The relationship can become useful because it summarizes the depth of normal corrections during that particular trend.
The trader should still watch actual price structure. If the index falls below the average, breaks an important higher low and then fails to recover, the trend behavior has materially changed.
The moving average should not be defended as though price is required to respect it.
Trend Trading and Momentum
Momentum helps distinguish a strong trend leg from a weakening move.
Suppose GBP/USD remains structurally bearish. During each decline, bearish momentum expands, while recoveries occur with weaker momentum.
This supports the continuation interpretation.
Later, downside momentum begins weakening significantly while recoveries become stronger. The trend is still technically bearish, but its quality is deteriorating.
Trend traders can use this information to reduce aggressiveness before a full structural reversal becomes obvious.
Momentum therefore provides supplementary evidence rather than replacing the actual trend.
Trend Trading and Volatility
Volatility affects how trend trades should be structured. High-volatility trends can produce deep pullbacks while remaining directionally intact, whereas low-volatility trends may react to much smaller corrections.
Suppose EUR/USD daily volatility doubles after a major economic shift. A stop distance that worked during the previous quiet regime may now sit inside ordinary market noise.
Trend traders should therefore evaluate stop placement and position sizing relative to current movement.
A wider stop does not automatically mean greater account risk if position size is reduced appropriately.
Trend Trading and Volume
Participation can provide additional confirmation in markets where relevant volume data is available. A breakout in the direction of a trend that attracts increasing activity can appear more convincing than one occurring during unusually quiet conditions.
Volume should not be treated as mandatory confirmation. Strong trends can continue during periods of declining participation, and high-volume moves can reverse.
The most useful interpretation comes from comparing current participation with the market's recent behavior while also observing price structure.
Trend Trading on MetaTrader 5
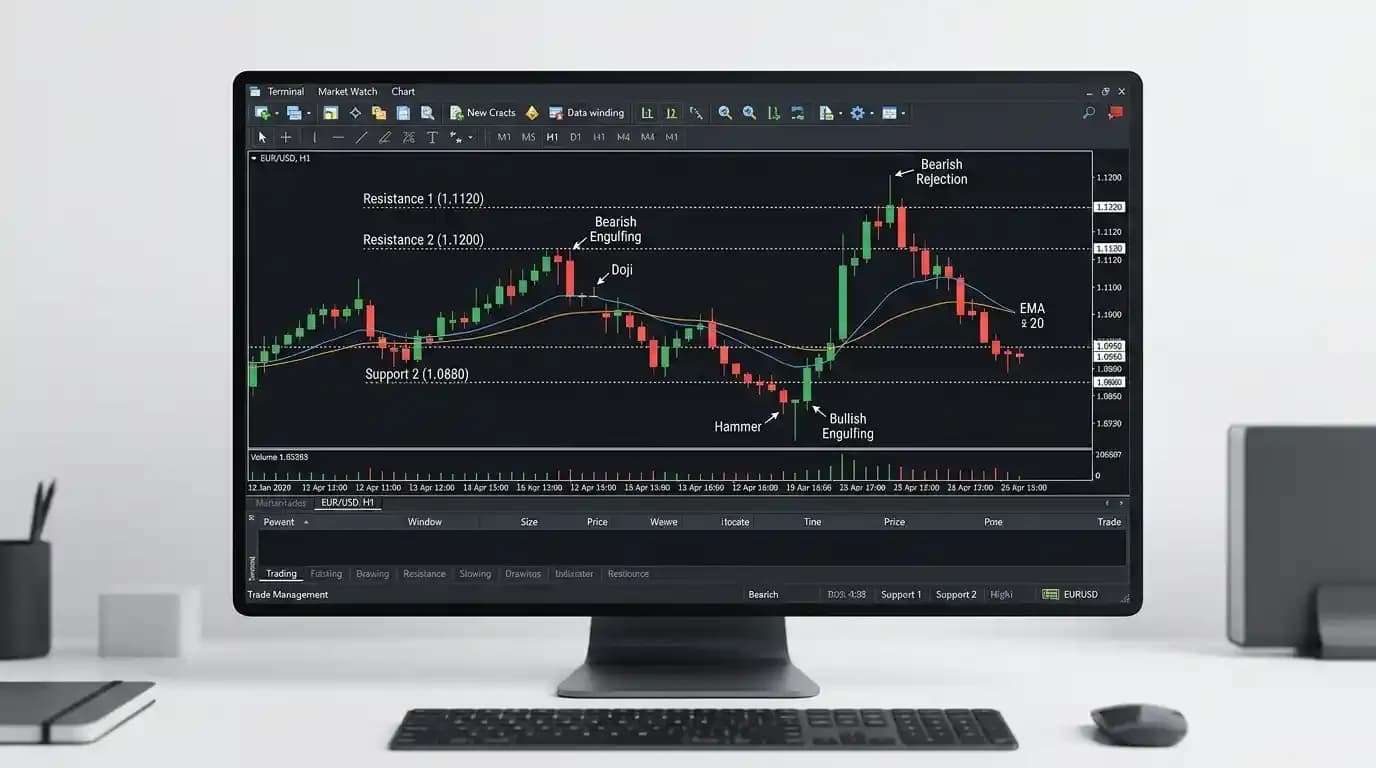
Traders can use the MetaTrader 5 platform to study supported instruments across multiple timeframes and apply moving averages, ADX and other available technical tools.
A trend trading chart does not need to contain many indicators. Price structure, one directional tool and perhaps a volatility measurement can often provide sufficient information.
Adding more indicators can create the illusion of certainty because several tools may produce similar signals from the same price data.
The purpose of the platform is to organize market information, not to replace decision-making.
Trend Trading in Forex
Trend trading is widely used in forex trading because currency pairs can develop sustained directional movements when interest-rate expectations, economic data or central-bank policies diverge.
A currency trend can continue for weeks or months, but intraday pullbacks still occur regularly.
Suppose EUR/USD remains in a higher-timeframe uptrend. A trader may wait for four-hour corrections instead of chasing daily highs.
The main challenge is recognizing when the economic and technical environment has changed enough for the trend to lose validity.
Technical structure can provide the exit signal even when the trader does not know the exact fundamental reason for the change.
Trend Trading in Gold
Gold can develop powerful trends when real-rate expectations, currency conditions or geopolitical risk shift. These moves can attract trend traders because price may maintain directional structure across several timeframes.
Gold can also reverse sharply.
A trader entering late after a series of large bullish candles may face a substantial pullback even while the long-term trend remains positive.
This makes entry location, stop distance and position size particularly important.
The objective should be to participate in a favorable section of the trend rather than attempting to capture every point of movement.
Trend Trading in Indices
Equity indices can form sustained trends driven by earnings expectations, monetary conditions and broader investor sentiment. Trend traders may use longer-term moving averages, breakout structures or higher highs and higher lows to assess direction.
Intraday traders may also combine the broader trend with the active market session.
For traders in Pakistan, US index activity generally becomes most important later in the local day. A directional move may accelerate after the underlying market opens, which means entry decisions made during quieter periods should account for the potential change in volatility.
Trend Trading in Cryptocurrency Markets
Trend trading can also be applied to supported cryptocurrency instruments. Crypto markets can form extremely strong trends but may also reverse much faster than traditional markets.
A trend-following approach can help traders avoid repeatedly fighting directional momentum, but high volatility makes late entry particularly dangerous.
A market can be structurally bullish while still experiencing a large percentage pullback.
Position size should therefore reflect actual volatility rather than the trader's confidence in the trend.
Trend Trading for Traders in Pakistan
The principles of trend trading are the same for traders in Pakistan, but session timing affects which markets are most active at different parts of the day. European forex movement becomes relevant during Pakistan's daytime, while US markets are generally more active later.
A trader following a four-hour forex trend may not need to monitor every minute, whereas a short-term US index trend strategy can require more attention during the evening in Pakistan Standard Time.
The chosen timeframe should fit the trader's available schedule.
A good strategy that cannot be monitored properly can become difficult to execute consistently.
Trend Trading in Khyber Pakhtunkhwa
For traders in Peshawar, Mardan, Abbottabad, Swat, Kohat, Nowshera, Bannu, Mansehra, Haripur, Swabi and other parts of Khyber Pakhtunkhwa, trend trading itself does not change. The same EUR/USD or gold structure is visible to market participants using the same price feed.
Practical considerations can influence strategy selection. Someone with limited screen time may prefer four-hour or daily trends. A trader who actively monitors European forex activity during Pakistan's daytime can use shorter intervals. Connectivity also matters because a very short-term trend strategy may require rapid execution during volatile periods.
The analytical method should fit actual working conditions rather than assuming uninterrupted access and continuous monitoring.
Trend Trading and Risk Management
Risk management is central to trend trading because not every identified trend continues. A trader can correctly recognize the direction and still lose money by entering too late, placing a stop too close to ordinary volatility or using excessive leverage.
Suppose EUR/USD is in a clear uptrend, and a technically logical stop sits 60 pips below the proposed entry. If the trader wants to risk a fixed amount of capital, position size should be determined from that distance.
Moving the stop to only 15 pips simply to trade a larger position changes the technical logic of the setup.
The trend should determine where the idea becomes invalid. Risk limits should determine how large the position can be.
Stop-Loss Placement in Trend Trading
A stop should normally be placed where the original trend setup no longer makes sense, not at an arbitrary distance selected solely for convenience.
In an uptrend, this might be beneath an important higher low or structural support. In a downtrend, it could be above a meaningful lower high.
The correct location depends on the strategy and timeframe.
A trader should also consider current volatility. If normal hourly movement is 30 pips, placing a five-pip stop inside ordinary market noise can result in frequent exits even when the broader trend remains intact.
Reversal Stop-Loss Concepts
Understanding reversal stop loss placement can also help trend traders appreciate how different strategies define invalidation. A reversal trader often places risk beyond the extreme expected to mark the turning point, while a trend trader generally protects against failure of continuation structure.
The distinction illustrates why stop placement should come from the trade thesis.
A trend entry and a reversal entry may occur near the same market level while requiring completely different invalidation logic.
Using one universal stop formula across every strategy ignores these structural differences.
Position Sizing
Position size determines how much money is exposed if the trend setup fails.
A simplified relationship is:
Position size = Acceptable monetary risk ÷ Stop-loss distance adjusted for point or pip value
Suppose a trader is willing to lose $100 if the trade fails. A 20-pip stop permits a different position size from an 80-pip stop.
If the stop becomes four times wider, position size generally needs to become smaller if the same monetary risk is to be maintained.
This principle prevents high-volatility trends from automatically creating larger financial exposure.
Risk-to-Reward in Trend Trading
Trend trading can produce favorable reward potential when the market maintains direction for a long period. This does not mean every individual trend trade has an attractive reward-to-risk relationship.
Suppose EUR/USD is already close to major resistance while the logical trend stop sits far below. Buying at that point may offer limited upside relative to the risk.
A pullback entry can sometimes improve the relationship by allowing entry closer to structural support.
Trend traders should therefore evaluate location rather than assuming that following direction automatically produces good reward-to-risk.
Partial Exits and Trailing Stops
Some trend traders use partial exits or trailing stops to remain involved while protecting part of the position.
A trailing stop can move upward beneath new higher lows during an uptrend or downward above lower highs during a decline.
The advantage is that the exit adapts as the trend progresses.
The disadvantage is that stops moved too aggressively can remove the position during a normal pullback before the trend resumes.
There is no universally correct trailing method. The approach should match the timeframe and normal volatility of the market being traded.
Trend Trading Psychology
Trend trading can be psychologically difficult because it often requires buying after price has already risen or selling after it has already fallen. Traders naturally want a better price and may wait for a deeper pullback that never arrives.
The opposite problem occurs when a trader finally enters after watching the trend continue for a long time. Fear of missing out can lead to late entry at the worst possible location.
Successful trend trading therefore requires accepting that some trends will leave without providing an attractive setup.
There is no obligation to participate in every move.
Taking Profits Too Early
Trend traders can also struggle with taking profits too quickly. After entering successfully, a small gain may feel too valuable to risk losing, so the trader exits even though the trend structure remains intact.
This behavior can create an unfavorable pattern where losing trades are allowed to reach full stop distance while winning trades are cut before larger trends can develop.
The solution is not to hold every trade indefinitely. It is to define the exit logic in advance.
If the strategy intends to follow structural highs and lows, the exit should generally respond to structural change rather than moment-to-moment emotion.
Refusing to Exit a Broken Trend
The opposite mistake is holding too long after the trend has clearly deteriorated.
A trader may remain bullish because the market had been rising for months, even after price breaks major support, forms a lower high and begins establishing lower lows.
At this point, loyalty to the previous trend has replaced analysis.
A trend-following approach should be adaptable. The trader participates while the directional evidence remains valid and leaves when that evidence materially changes.
Trend trading is not about being permanently bullish or bearish.
Common Trend Trading Mistakes
Trend traders frequently enter after large extensions, mistake sideways markets for weak trends, use too many lagging indicators, place stops inside normal volatility or assume that high ADX means continuation must occur. Others repeatedly change the timeframe when a trade moves against them, using a larger chart to justify holding a position that has already failed on the original timeframe.
A more consistent approach defines the trend, entry timeframe, invalidation point and risk before execution.
If the original setup fails, the trader should reassess rather than searching for a new interpretation that keeps the losing position alive.
Chasing the Trend
Chasing occurs when a trader enters primarily because price is moving quickly and fear of missing out becomes stronger than the original trading criteria.
Suppose gold breaks resistance and immediately rises $60. The trader buys after the expansion because the move appears certain.
The nearest meaningful support may now be $40 or $50 below the entry, while the next resistance is only $20 higher.
The trend can still be bullish while the specific trade is unattractive.
Waiting for another setup may be more disciplined than entering simply because the market is moving.
Trading Trends During Ranges
Trend-following strategies often suffer when markets become range-bound. Price may cross moving averages repeatedly, trigger breakouts in both directions and reverse before establishing sustained movement.
Suppose EUR/USD trades between 1.0950 and 1.1050 for several weeks. Every movement toward the top looks temporarily bullish, and every decline toward the bottom looks bearish.
A trend trader who treats these swings as new trends can experience repeated whipsaws.
Recognizing that no meaningful trend exists is itself an important trading decision.
Sometimes the best trend trade is no trade.
Using Too Many Trend Indicators
A chart containing five moving averages, ADX, Aroon, Ichimoku and several additional directional tools may appear comprehensive, but much of the information can overlap.
If all the indicators are derived from the same rising price series, agreement among them does not necessarily represent independent confirmation.
A cleaner approach might use price structure for direction, one trend-strength tool for context and one volatility measure for risk.
The purpose of indicators is to simplify information, not to make a basic trend impossible to see beneath dozens of lines.
A Practical Uptrend Example
Suppose EUR/USD is trading on a four-hour chart. The pair forms a higher low at 1.0900 and later breaks above resistance at 1.1000, reaching 1.1080. Instead of buying immediately after the breakout, a trader waits for a pullback.
EUR/USD returns toward 1.1010 but remains above the previous higher low. Selling momentum gradually weakens. Price then begins rising again and breaks above a short-term high at 1.1040.
The trader now has a broader uptrend, a controlled pullback and evidence that buyers are returning.
A stop can be placed according to the structural invalidation level, and position size can be calculated from that distance.
If EUR/USD later breaks the important higher low, the trend thesis should be reconsidered.
A Practical Downtrend Example
Suppose GBP/USD is producing lower highs and lower lows. The pair falls from 1.2900 to 1.2700 before recovering toward 1.2790. Previous support around 1.2800 now acts as resistance, and the recovery begins weakening.
GBP/USD forms another lower high and falls below short-term support.
The trader may interpret this as bearish continuation within the larger downtrend.
The key is that the entry occurs during a recovery rather than after the market has already completed another large decline.
If GBP/USD breaks above the meaningful lower high and maintains the move, the bearish structure is no longer as strong.
A Practical Moving Average Trend Example
Suppose gold remains above a rising 50 EMA while also forming higher highs and higher lows. During the next pullback, price approaches both previous support and the moving average.
Gold stabilizes near the region and begins recovering.
The moving average supports the broader directional interpretation, while price structure provides the actual entry logic.
If gold falls below the average but maintains structural support, the trader may wait rather than exiting automatically.
If price breaks both the support and the latest major higher low, the trend has materially weakened.
The structure remains more important than the indicator line.
A Practical Multi-Timeframe Example
Suppose the daily EUR/USD chart remains bullish. On the four-hour chart, price enters a correction and falls toward daily support. The one-hour chart is temporarily bearish during this pullback.
Instead of buying because the daily chart is bullish, the trader waits.
The one-hour chart eventually stops making lower lows and breaks above the latest lower high. A subsequent pullback forms a higher low.
The three timeframes now fit together: daily uptrend, four-hour correction into support and one-hour structural recovery.
This does not guarantee a successful trade, but it creates a coherent trend-following scenario.
A Trend Trading Checklist
Before entering a trend trade, a trader can verify a small set of core conditions:
- The broader market shows a recognizable directional structure rather than random sideways movement.
- The entry is not excessively extended from meaningful support or resistance.
- The invalidation level is defined before entry.
- Position size reflects the actual stop distance and acceptable monetary risk.
- The selected timeframe fits the trader's ability to monitor the position.
These checks are deliberately limited. The goal is to prevent obvious structural and risk errors rather than create a checklist so large that every market can be rationalized into a trade.
Trend Trading FAQs
What is trend trading?
Trend trading is a strategy that attempts to participate in sustained upward or downward market movement while the directional structure remains valid.
What does an uptrend look like?
An uptrend generally forms higher highs and higher lows.
What does a downtrend look like?
A downtrend generally forms lower highs and lower lows.
How do traders identify a trend?
Traders can use market structure, moving averages, ADX, Ichimoku, Donchian Channels or combinations of these tools.
Is trend trading the same as momentum trading?
No. Trend trading focuses primarily on sustained direction, while momentum analysis focuses more on the speed or strength of movement.
What is the best indicator for trend trading?
There is no universally best indicator. Moving averages, ADX, Ichimoku and Donchian Channels provide different types of trend information.
Can trend trading work without indicators?
Yes. Traders can identify directional structure directly from meaningful highs and lows.
What is a trend pullback?
A pullback is temporary movement against the broader trend that does not necessarily invalidate the underlying directional structure.
What is a buy-the-dip strategy?
It involves looking for long entries during temporary declines within a broader uptrend rather than buying after price has already accelerated.
Can traders sell rallies in a downtrend?
Yes. Some trend strategies use temporary recoveries within a broader decline as potential entry areas.
What is late trend entry risk?
It is the risk of entering after a trend has already moved substantially, leaving poor entry location, distant support or resistance and an unattractive reward-to-risk relationship.
Does high ADX guarantee trend continuation?
No. ADX measures directional strength and can remain high near the end of a trend.
Are moving averages useful for trend trading?
Yes. They can help summarize direction and pullbacks, but they lag price and can generate false signals during ranges.
What is Donchian trend following?
It is a trend-following approach that uses recent highest highs and lowest lows to identify potential directional breakouts.
Can Ichimoku be used for trend trading?
Yes. Ichimoku can provide trend, momentum and support or resistance context, but its signals can still fail.
Is breakout trading a trend strategy?
It can be. Breakouts in the direction of an established trend are commonly used as continuation entries.
What is multi-timeframe trend trading?
It uses a higher timeframe for broad direction and lower timeframes for pullbacks, structure or entry timing.
Should every timeframe agree?
No. Lower timeframes often move against the higher-timeframe trend during normal corrections.
How should stops be placed in trend trading?
Stops should generally be based on the point where the trend setup becomes invalid, with position size adjusted to keep financial risk within the trader's intended limit.
Is a wider stop safer?
Not automatically. A wider stop creates greater price tolerance but requires smaller position size if the same monetary risk is to be maintained.
Can a strong trend reverse suddenly?
Yes. New information, changes in liquidity or shifts in market expectations can reverse even well-established trends.
Is trend trading suitable for forex?
Yes. Currency pairs can develop sustained directional moves that are suitable for trend analysis.
Can trend trading be used for gold?
Yes, although gold's volatility can create deep pullbacks and rapid reversals.
Can trend trading be used for indices?
Yes. Indices can form strong trends across both intraday and longer-term timeframes.
Can trend trading be used for cryptocurrency markets?
Yes, but cryptocurrency volatility can make late entries and excessive leverage particularly risky.
Does trend trading work differently in Pakistan?
The underlying strategy is the same. Traders in Pakistan mainly need to account for when European and US markets become active in Pakistan Standard Time.
Is trend trading different for traders in KPK?
No. Traders in Peshawar, Mardan, Abbottabad, Swat and elsewhere in KPK can apply the same trend principles. Local schedule and connectivity may influence the most practical timeframe.
What is the biggest trend trading mistake?
One of the biggest mistakes is chasing an extended trend after the reward-to-risk relationship has already deteriorated.
Can trend trading guarantee profits?
No. Trends can end unexpectedly, indicators can lag and false breakouts or reversals can create losses.
Disclaimer: Trend trading strategies, moving averages, ADX, Ichimoku, Donchian breakouts and trend-structure examples describe historical and current market behavior and cannot guarantee that an established direction will continue. Trends can weaken, consolidate or reverse abruptly, late entries can expose traders to large pullbacks, and leveraged positions can substantially increase losses when the market moves against the trade. This material is provided for general educational purposes and is not personalized investment, trading, financial, legal or tax advice. Medatiq's supported instruments, spreads, execution conditions, margin requirements and platform functionality may vary or change.
Trade forex, gold, and indices with Medatiq Markets
Enjoy tight spreads and fast execution, built for market condition.