Price Action Trading: Complete Guide to Reading the Market
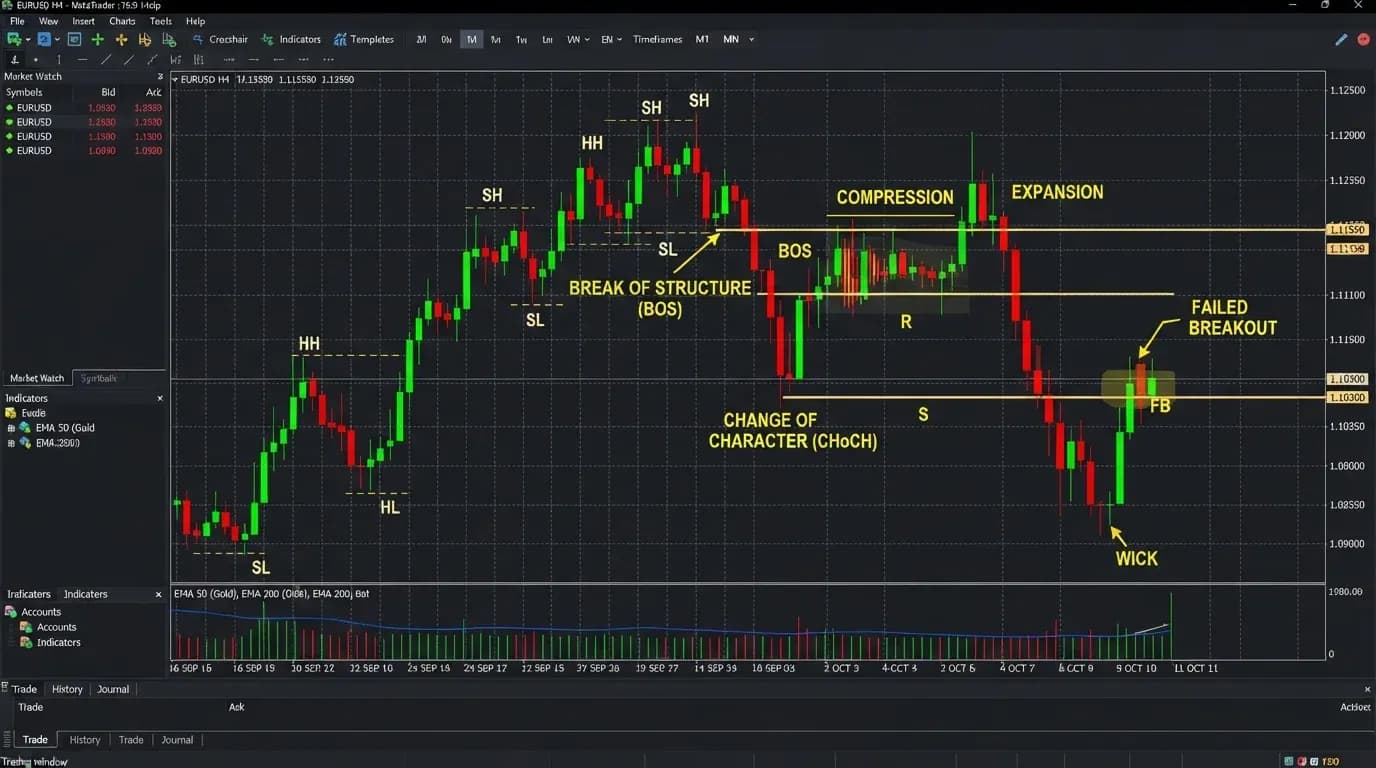
Price action trading is the process of analyzing how market prices move and interact with important levels without depending heavily on complex indicator combinations. Instead of asking an indicator to summarize what has already happened, a price action trader studies the actual sequence of highs, lows, trends, ranges, breakouts, failed breakouts, support, resistance and changes in momentum visible on the chart. The objective is not to predict every market move correctly. It is to understand what buyers and sellers are currently doing, identify conditions that may favor one scenario over another and define where that interpretation would become invalid. Price action trading can be applied to forex, gold, indices and other actively traded markets, but its simplicity can be deceptive. A clean chart does not remove uncertainty, and concepts such as market structure, break of structure, change of character and liquidity-related price behavior can be misused when traders try to force certainty onto normal market noise. A disciplined approach therefore combines price structure, timeframe context, volatility and risk control rather than treating every breakout, wick or swing point as a trade signal.
The broader framework of technical analysis for trading provides useful context, while chart patterns trading shows how repeated price behavior can develop into recognizable multi-candle structures. Price action trading goes one step closer to the underlying chart by focusing on what price itself is doing even when no named pattern is present.
What Is Price Action Trading?
Price action trading is a chart-reading approach centered on market price rather than a large collection of derived indicators. Traders examine the relationships between recent highs and lows, the direction of trends, reactions at support and resistance, the strength of breakouts, the quality of pullbacks and how quickly price expands or contracts. Candlesticks may help show intraperiod behavior, but price action is broader than candlestick patterns alone because it also includes larger structural changes unfolding across many candles.
Suppose EUR/USD has been making higher highs and higher lows for several sessions. Price then pulls back toward previous support, stops declining and begins producing another higher low. A price action trader can recognize this as a continuation of bullish structure without needing an oscillator to label the market as bullish. If price later breaks the latest higher low and begins forming lower highs, the trader can also recognize that the structure is changing.
The advantage of price action is directness. The challenge is subjectivity. Two traders can interpret the same chart differently unless they use clear definitions and consistent rules.
Why Traders Use Price Action
Many traders prefer price action because every technical indicator ultimately begins with market data. Moving averages use past prices. Momentum tools transform price changes. Volatility indicators calculate trading ranges or dispersion. Price action trading starts directly with the source data and attempts to interpret the visible relationship between buyers and sellers.
This can make charts cleaner and reduce conflicting signals. A trader does not need five oscillators to determine whether EUR/USD is making higher highs. The chart already shows it.
However, price action should not be confused with simplicity of decision-making. Removing indicators does not remove uncertainty. A trader still needs to determine which swing points matter, whether a breakout is genuine, whether support is meaningful and whether a lower-timeframe movement is simply noise inside a larger trend.
The quality of price action analysis therefore depends more on disciplined interpretation than on how empty the chart looks.
Market Structure Is the Foundation
Market structure trading is one of the most important foundations of price action. Structure describes how meaningful highs and lows develop over time.
An uptrend generally forms higher highs and higher lows. A downtrend generally forms lower highs and lower lows. A range develops when neither sequence dominates and price repeatedly rotates between broader boundaries.
Consider this sequence:
Low: 1.0800
High: 1.0900
Higher low: 1.0850
Higher high: 1.0960
Higher low: 1.0900
Higher high: 1.1020
The market is showing upward structure because buyers have repeatedly supported price at progressively higher levels while also pushing to new highs.
Price action trading begins by recognizing this structural progression before looking for a specific entry.
Swing Highs and Swing Lows
A swing high is a meaningful local peak where price stops rising and begins declining. A swing low is a meaningful local bottom where price stops falling and begins rising. These swings create the structure from which trends, ranges and breakouts are identified.
Not every tiny fluctuation should be treated as a meaningful swing. If every candle high becomes a structural high and every candle low becomes a structural low, the chart becomes unusable.
The relevant swings depend on timeframe and strategy. A trader using a four-hour chart will normally ignore many five-minute fluctuations that matter to an intraday trader.
This is why price action trading requires consistent scale. The trader should know which timeframe defines the broader structure and which timeframe is being used for execution.
Higher Highs and Higher Lows
An uptrend remains structurally intact while price continues creating higher highs and higher lows.
Suppose GBP/USD rises from 1.2700 to 1.2850, pulls back to 1.2780 and then advances to 1.2920. The pullback remained above the previous low, and the subsequent rally exceeded the previous high.
The structure remains bullish.
A trader may then monitor the next pullback rather than buying after the strongest part of the rally.
If GBP/USD later falls below 1.2780 and begins producing lower highs, the earlier bullish structure becomes weaker.
Price action therefore gives traders conditional reference points rather than fixed predictions.
Lower Highs and Lower Lows
A downtrend shows the opposite progression.
Suppose EUR/USD falls from 1.1100 to 1.0950, rebounds to 1.1030 and then falls to 1.0900. Sellers have prevented the recovery from reaching the previous high and have also pushed price to a new low.
The market contains a lower high and lower low.
A price action trader may therefore treat temporary rallies as corrections while that sequence remains intact.
If EUR/USD eventually breaks above a meaningful lower high, the trader can reassess whether the bearish structure is changing.
This is more objective than maintaining a bearish opinion regardless of what the market actually does.
Break of Structure
A break of structure trading event occurs when price moves beyond an important structural high or low. The exact interpretation depends on the preceding market condition.
Suppose EUR/USD is in an uptrend with a series of higher highs and higher lows. Price then breaks above the previous significant high. Traders may interpret this as bullish continuation because the market has extended the existing structure.
In a downtrend, a break below a meaningful previous low can represent bearish continuation.
The key word is meaningful. A small movement beyond a minor intraday fluctuation is not necessarily a major structural break.
Price action traders should define which swing points matter before the breakout occurs rather than selecting whichever level supports the desired interpretation afterward.
Continuation Break of Structure
A continuation break of structure occurs when price extends the existing trend.
Suppose gold is making higher highs and higher lows. The latest major high is 2,500. Price consolidates beneath that level and later closes strongly at 2,520.
The move above 2,500 extends the bullish structure.
This does not guarantee that gold will continue rising. Price can break the high and then reverse.
The break simply confirms that buyers were able to move price beyond the previous structural peak.
A trader can then evaluate whether the breakout is accepted, whether price retests the level and whether the next pullback maintains bullish structure.
Change of Character
Change of character trading is commonly used to describe an early shift in how price is behaving relative to the previous trend. The concept usually focuses on price breaking an opposing structural point before a fully established new trend has formed.
Suppose EUR/USD has been making lower highs and lower lows. Price then rallies strongly enough to break above a meaningful recent lower high. The market has not automatically become a confirmed uptrend, but the previous bearish sequence has changed.
This can be interpreted as an early warning that sellers are losing structural control.
The concept is useful when applied carefully, but traders should avoid labeling every small countertrend break as a major change of character. Timeframe and swing significance remain essential.
Break of Structure vs Change of Character
A break of structure often describes continuation in the direction of the prevailing trend, while a change of character generally refers to a structural break against the previous trend. These definitions can vary among traders, so consistency matters more than terminology.
Suppose the market is bullish. A move above the previous high can be viewed as continuation. A move below a major higher low can indicate a possible change in behavior.
The terminology should help organize the chart rather than make the analysis sound more sophisticated. The underlying information remains simple: which important high or low was broken, and what does that break imply about the existing sequence?
Support and Resistance in Price Action
Support and resistance remain central to price action trading. These areas show where price has previously attracted meaningful buying or selling pressure.
A trader may identify support from repeated lows, previous breakout areas or important structural reaction points. Resistance can develop around prior highs or zones where rising prices repeatedly failed.
Suppose EUR/USD breaks above resistance at 1.1050 and later returns toward the level. If buyers defend the former resistance, price action may show that the level has become support.
The key evidence is the market's reaction around the area rather than the existence of a line on the chart.
Price Rejection
Rejection occurs when price moves into or beyond an area but fails to maintain that movement.
Suppose GBP/USD approaches resistance at 1.2900, trades to 1.2930 and then closes back at 1.2870. The market tested higher prices but did not maintain them.
A long upper wick can visually represent this rejection, but the concept is broader than the candle itself. The important observation is that the attempt to establish higher prices failed.
If subsequent price action also forms lower highs or breaks nearby support, the rejection gains greater significance.
A single wick without follow-through should not be treated as definitive evidence of reversal.
Acceptance vs Rejection
Price acceptance can be thought of as the opposite of rejection. If price breaks above resistance and then remains above the level, consolidates there and continues higher, the market appears to be accepting trading at the new prices.
Suppose EUR/USD breaks above 1.1050 and spends several hours between 1.1055 and 1.1080 instead of falling back below the breakout. This behavior differs from a brief spike to 1.1070 followed by an immediate close at 1.1020.
The first example suggests acceptance above resistance. The second shows rejection.
Price action trading often becomes clearer when traders ask whether the market is accepting or rejecting a price region rather than trying to interpret every candle individually.
Price Compression
Price compression trading describes conditions in which price ranges gradually contract. Highs and lows may converge, candles can become smaller and volatility often declines.
Compression frequently develops near important support or resistance as buyers and sellers temporarily balance.
Suppose EUR/USD approaches resistance at 1.1100. Instead of rejecting sharply, price repeatedly pulls back by smaller amounts: first to 1.1040, then 1.1060, then 1.1080. The market is compressing beneath resistance.
This behavior can indicate increasing pressure on the level because sellers are unable to push price as far down after each test.
However, compression does not guarantee that resistance will break. Price can still reverse sharply.
Price Expansion
Price expansion trading occurs when market ranges increase after quieter conditions. Candles become larger, price travels further and volatility rises.
Expansion often follows compression or consolidation.
Suppose gold spends several sessions inside a narrow range and then breaks above resistance with a series of large bullish candles. The transition from small ranges to larger movement represents price expansion.
Expansion can indicate that the market has moved out of balance and entered a more directional phase.
The direction still needs to be evaluated separately. Price can expand upward, downward or in both directions during extremely volatile events.
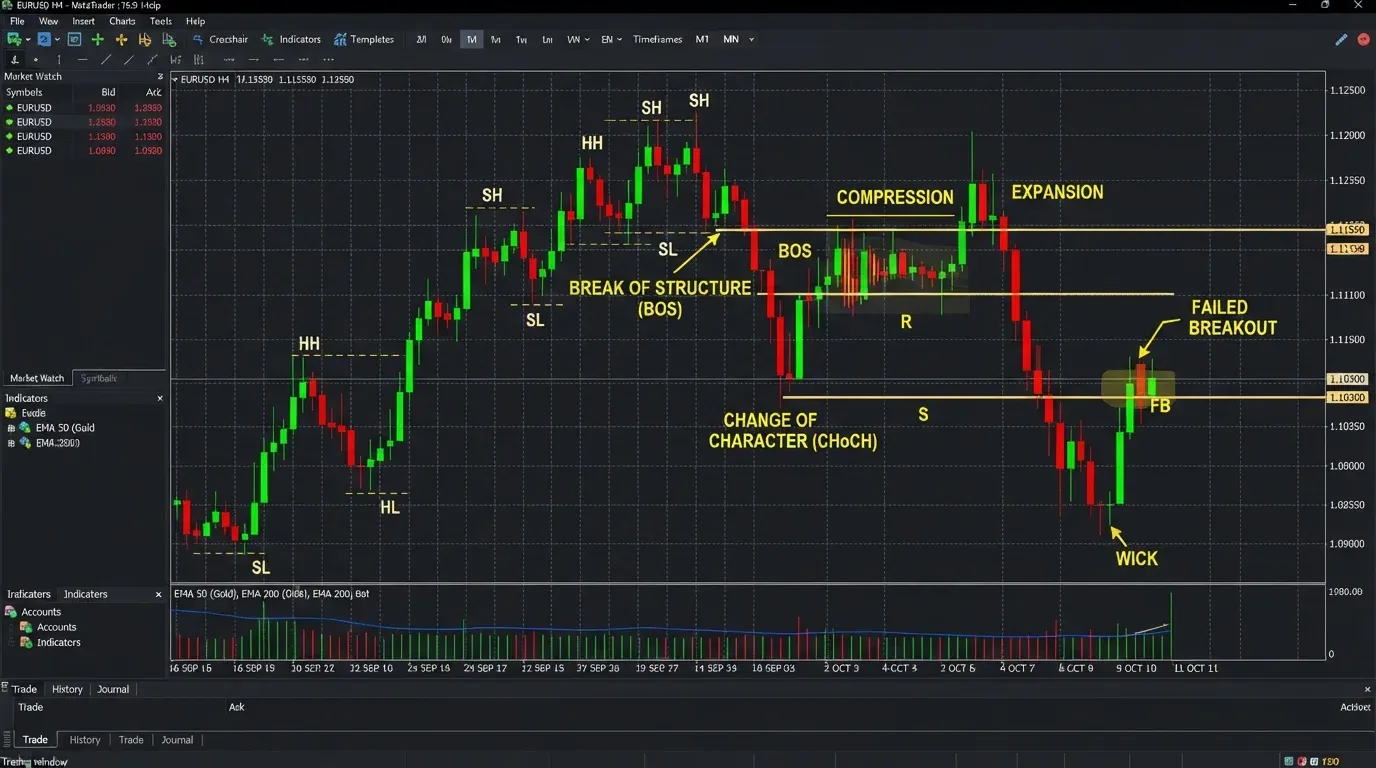
Compression Before Breakout
Compression near a level can be especially useful because it shows how price behaves as the market repeatedly approaches a boundary.
Suppose GBP/USD has resistance at 1.2850. Earlier attempts were rejected strongly, falling 100 pips after each test. Later attempts produce only 50-pip declines, then 25-pip declines.
Buyers are maintaining progressively higher prices beneath resistance.
If GBP/USD eventually breaks above 1.2850, the preceding compression provides context for why the level may have become vulnerable.
If price instead falls sharply from the compression, the expected breakout has failed and the compressed structure becomes a warning that sellers regained control.
Failed Breakout Trading
Failed breakout trading focuses on what happens when price moves beyond an important boundary but cannot maintain the breakout.
Suppose EUR/USD resistance sits at 1.1100. Price rises to 1.1130, attracts breakout buyers and then quickly falls back below 1.1100.
The market has rejected the higher prices.
If EUR/USD subsequently breaks short-term support, the failed breakout may provide stronger bearish evidence than resistance alone.
Failed breakouts are important because they show that one side of the market attempted to establish control beyond a recognized level and failed.
False Breakout vs Liquidity Sweep
The distinction between a false breakout vs liquidity sweep is often discussed when price trades beyond obvious highs or lows and then reverses.
From a practical price action perspective, traders should avoid assuming they know the intentions of every market participant. A move beyond a prior high can trigger stop orders and breakout entries, but the visible fact is simply that price traded beyond the level and later returned.
The most useful questions are whether the market maintained the breakout, where the candle closed, whether the opposite structure then broke and how price behaved after returning inside the prior range.
These observations are more defensible than attributing every wick to a specific institutional strategy.
Liquidity Around Obvious Levels
Obvious highs and lows often attract market orders because traders place stops and breakout entries around them.
Suppose a previous high sits at 1.1200. Short sellers may place protective stops above it, while breakout traders may place buy orders beyond it.
When price approaches 1.1200, these orders can contribute to increased activity.
If price breaks above the level and continues higher, the breakout has been accepted.
If it immediately reverses, the move may resemble a failed breakout or liquidity-related sweep.
The level matters because market participants recognize it, not because the number itself possesses any special force.
Fair Value Gaps
Fair value gaps trading generally refers to areas created during rapid price movement where consecutive candles leave relatively limited overlap under commonly used definitions. Traders sometimes interpret these areas as evidence of strong directional imbalance.
Suppose price accelerates sharply upward across several candles and leaves a visually obvious region that was traversed quickly. Some traders later watch whether price returns toward that area.
The concept can be useful as a way to describe rapid movement, but traders should avoid assuming that price is mathematically required to "fill" every gap-like structure. Markets can continue trending without returning to a particular area for a long time or at all.
A fair value gap should therefore be treated as a reference zone rather than an obligation placed on future price.
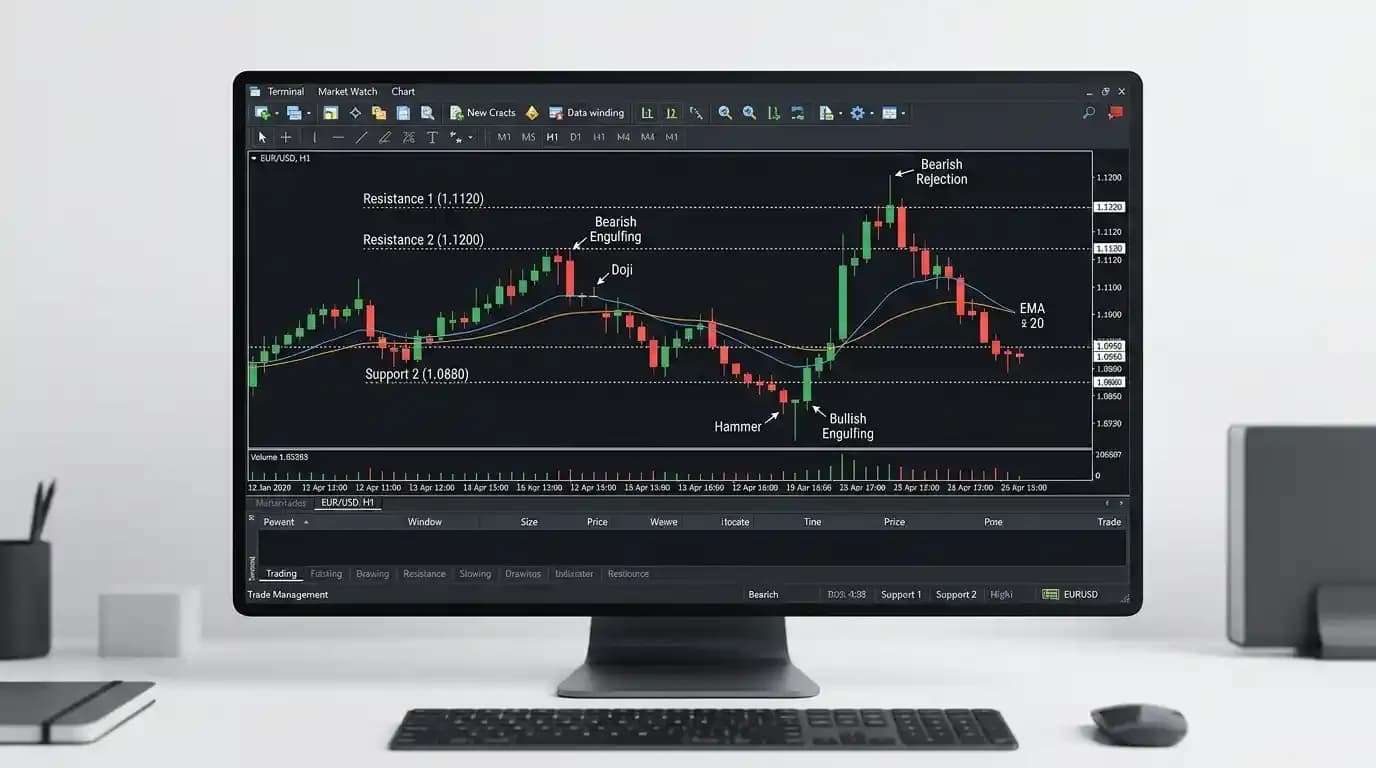
Price Action and Candlestick Patterns
Candlestick patterns can add detail to broader price action analysis. A hammer, engulfing candle or doji becomes more useful when it forms at a structurally important area.
Suppose EUR/USD is in an uptrend and pulls back toward established support. Price briefly trades below the level and then forms a strong bullish rejection candle. The candle helps show that lower prices were rejected.
The broader price action still matters more than the name of the pattern. If EUR/USD subsequently breaks below support, the bullish candle has failed.
Price action therefore uses candlesticks as evidence rather than treating them as independent signals.
Price Action and Chart Patterns
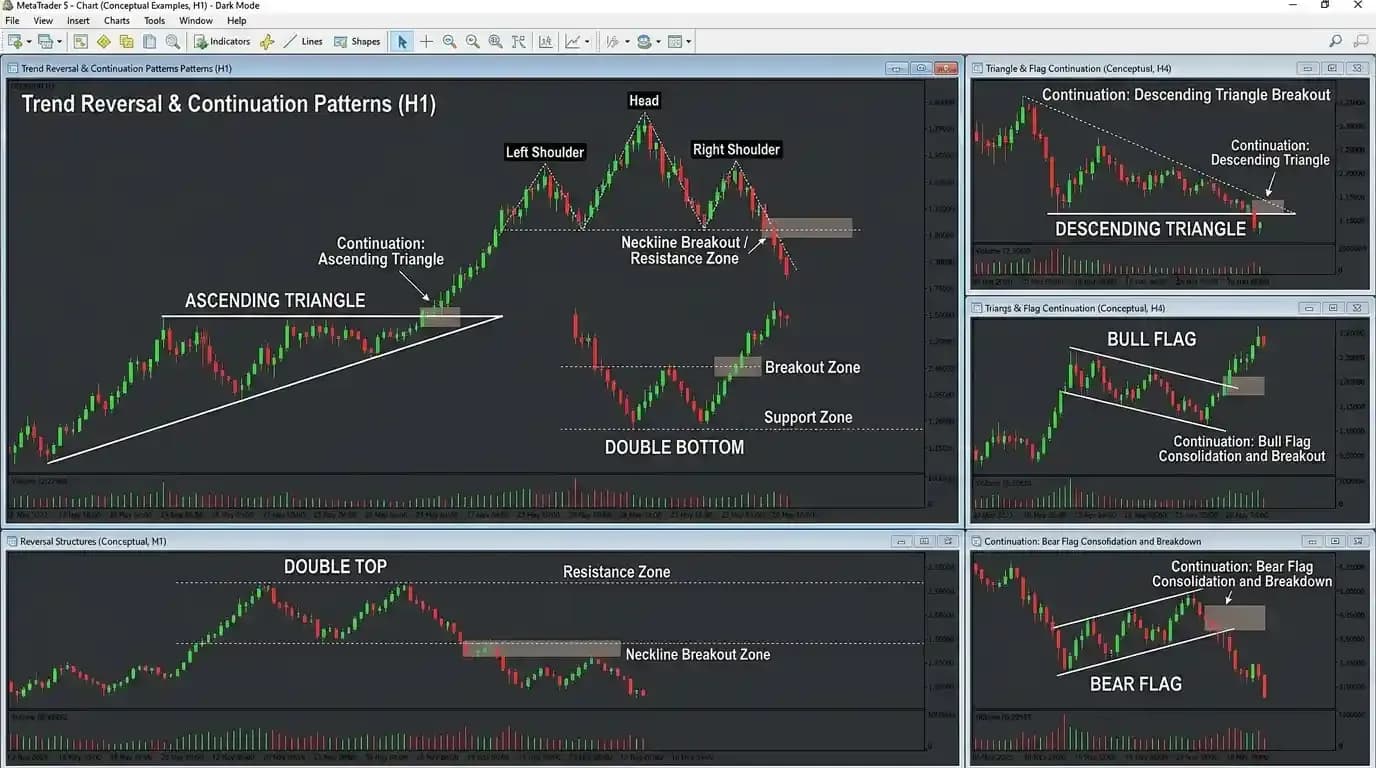
Named chart patterns such as triangles, flags and double tops are simply larger price action structures. An ascending triangle consists of repeated resistance and rising lows. A double top consists of repeated resistance followed by potential support failure. A bull flag reflects impulse, controlled correction and possible continuation.
Understanding chart patterns trading becomes easier when traders view each formation as a sequence of market decisions rather than a geometric shape.
The label can help communication, but the actual trade still depends on structure, breakout quality, invalidation and risk.
Multi-Timeframe Price Action
The next major principle is multi timeframe trading, because price action can look completely different depending on chart scale.
Suppose EUR/USD is bullish on the daily chart, ranging on the four-hour chart and temporarily bearish on the 15-minute chart. All three observations can be correct.
The daily chart may show a larger uptrend. The four-hour chart may show consolidation within that trend. The 15-minute decline may simply represent a temporary move toward four-hour support.
A trader who looks only at the 15-minute chart could mistake the pullback for a major reversal.
Multi-timeframe context helps distinguish local movement from broader structure.
Higher-Timeframe Bias
A higher timeframe can provide directional context without dictating every lower-timeframe decision.
Suppose the daily EUR/USD chart forms higher highs and higher lows. A trader may maintain a broadly bullish bias.
On the one-hour chart, price then breaks short-term support and falls.
The lower timeframe is temporarily bearish, but the daily structure remains intact until a meaningful daily or higher-timeframe level fails.
A trader can therefore distinguish between a short-term correction and a larger trend reversal.
The important point is not to force lower timeframes to agree with the higher timeframe. It is to understand which structure is controlling which trading horizon.
Lower-Timeframe Entries
Lower timeframes can help refine entries around higher-timeframe areas.
Suppose gold reaches daily support. Instead of buying immediately, a trader moves to the one-hour chart and observes whether the market stops making lower lows. Price then breaks above a meaningful one-hour lower high.
This lower-timeframe structural shift can provide more evidence that buyers are becoming active around the higher-timeframe support.
The trader still needs an invalidation point. If gold breaks the daily support despite the one-hour shift, the setup has failed.
Lower-timeframe confirmation can improve precision but cannot override a larger structural failure.
Price Action and Moving Averages
Price action trading does not forbid indicators. A trader can use one selectively if it provides useful context.
For example, moving averages trading may help show broader direction while price action controls actual entries.
Suppose EUR/USD remains above a rising 50 EMA and continues producing higher lows. The moving average confirms the broader trend, but a trader waits for a pullback toward support and a price action shift before entering.
The indicator is secondary to structure.
This approach can be more disciplined than entering every time price touches the moving average.
Simple Moving Average Indicator
A simple moving average indicator can provide a clean directional reference without overwhelming the chart.
Suppose GBP/USD remains below a falling 100 SMA while also producing lower highs. The price structure and average point in the same general direction.
If GBP/USD later breaks an important lower high and begins maintaining prices above the average, the market may be transitioning.
The trader still needs to evaluate actual support and resistance.
The moving average adds context rather than deciding the trade.
Price Action and Momentum
Momentum can help determine whether a price action move is accelerating or weakening.
Suppose EUR/USD breaks resistance and immediately produces several large bullish candles. The market is expanding with strong upward momentum.
Now suppose another breakout occurs but candles become progressively smaller and price repeatedly fails to extend higher. The breakout may be losing force.
A price action trader can often see these changes directly from candle size and structure, while a momentum indicator can quantify them if additional confirmation is useful.
The key is to avoid duplicating the same information unnecessarily.
Price Action and Volatility
Volatility affects how price action should be interpreted. A five-pip wick may be significant during an extremely quiet EUR/USD session and completely ordinary during an important economic release.
Likewise, a support zone that normally holds within a narrow ten-pip region may require much more tolerance when market volatility increases sharply.
Volatility indicators can help quantify these changes, but even visual observation of candle ranges can reveal whether the market environment has expanded.
Price action trading becomes more realistic when levels are interpreted relative to normal market movement rather than as exact mathematical barriers.
Price Action and Volume
Participation can add context to price action. Suppose an index breaks resistance while trading activity expands substantially. The breakout appears to have attracted greater participation.
If the same index moves above resistance during extremely low activity and then quickly reverses, the breakout may look less convincing.
The volume indicators trading framework can provide additional information, although volume should never be used as proof that the breakout will continue.
Price remains the final evidence.
Trend Continuation Price Action
A common continuation setup develops when an established trend pauses without breaking important structure.
Suppose EUR/USD is in an uptrend, producing higher highs and higher lows. Price pulls back from 1.1100 to 1.1030 but remains above the previous higher low at 1.1000. The pullback then begins losing downside momentum, and EUR/USD breaks above a short-term lower high at 1.1060.
The larger bullish structure remained intact throughout the correction.
The lower-timeframe shift suggests that buyers are returning.
This type of setup uses price action to enter with an existing trend rather than trying to predict the exact market bottom.
Reversal Price Action
A reversal requires stronger evidence because a trader is attempting to identify a change in the existing trend.
Suppose GBP/USD has been falling and producing lower highs and lower lows. The pair reaches support, forms a new low and then rallies above the latest significant lower high.
This is an early structural change.
The market then pulls back but forms a higher low rather than returning to the old low. Buyers subsequently push price to another higher high.
The sequence now provides much stronger evidence of reversal than a single bullish candle at support.
Price action reversals are most convincing when actual market structure changes, not merely when one pattern appears.
Range-Bound Price Action
Price action trading also applies to ranges.
Suppose EUR/USD repeatedly trades between support at 1.0950 and resistance at 1.1050. Neither buyers nor sellers can create a sustained breakout.
A trader can treat the range boundaries as the dominant structure until price proves otherwise.
Buying directly below resistance because one bullish candle appears ignores the broader context. Selling directly above support creates the same problem.
The center of the range often provides poor trade location because price can move in either direction before reaching a meaningful boundary.
Range traders therefore focus heavily on location, while breakout traders wait for acceptance beyond the range.
Range Breakout
A range breakout occurs when price moves beyond one of the established boundaries.
Suppose EUR/USD trades between 1.0950 and 1.1050 for several days. Price eventually closes above 1.1050.
The breakout becomes more convincing if EUR/USD remains above the level, retests it successfully or continues forming higher lows.
If price quickly returns below 1.1050, the breakout may have failed.
This distinction between acceptance and rejection is often more useful than whether one candle briefly traded beyond the boundary.
Price Action Around Economic News
Economic announcements can overwhelm recent technical structure. EUR/USD may be compressing perfectly beneath resistance until unexpected inflation data changes market expectations and sends price sharply in the opposite direction.
Price action trading does not eliminate this risk because it relies on information available before the event.
After the news, however, price action can help traders evaluate the new market structure. Did the breakout hold? Did a previous support level become resistance? Did volatility remain elevated or begin contracting?
Technical analysis becomes adaptive rather than predictive when traders accept that new information can change the chart quickly.
Price Action in Forex Trading
Price action is widely used in forex trading because currency pairs frequently create visible trends, ranges and session-specific breakouts.
A forex trader may study previous daily highs and lows, London-session structure, New York breakouts and the relationship between major support and resistance areas.
Suppose EUR/USD remains bullish on the four-hour chart but pulls back during a quiet session. When London activity increases, the pair breaks above the short-term correction structure.
The trader can interpret the move as continuation without needing a large indicator set.
Forex traders should still remember that central-bank decisions and major economic data can change structure abruptly.
Price Action in Gold
Gold often produces clear expansions, consolidations and rejection wicks around important levels. It can also move rapidly enough that small structural levels become irrelevant during volatile macroeconomic events.
A price action trader may identify a higher-timeframe support zone, then wait for lower-timeframe evidence that sellers are losing control.
This could involve failure to make a new low followed by a break above a recent lower high.
Gold's volatility makes risk particularly important. A technically correct idea can still require a wide invalidation level, which should be reflected in position size.
Price Action in Indices
Indices frequently create strong intraday trends, opening-range breakouts and failed breakouts. Market-opening activity can change structure quickly because participation rises sharply.
A trader may observe an index gap higher, initially continue upward and then fail to hold above the opening range. If price subsequently breaks the first meaningful intraday support, the failed bullish continuation can become important information.
For traders in Pakistan, active US index periods generally occur later in the local day, so short-term price action analysis should be aligned with the actual trading session.
Price Action in Cryptocurrency Markets
Price action can also be applied to supported cryptocurrency instruments. Higher highs, lower lows, support, resistance, consolidation and breakout logic remain the same.
The challenge is that crypto volatility can create very large wicks and rapid structural changes.
A small lower-timeframe break may have little meaning within a broader high-volatility environment.
Traders should therefore scale their interpretation to the instrument's normal movement and avoid assuming that every apparent liquidity sweep or failed breakout carries the same significance.
Price Action on MetaTrader 5
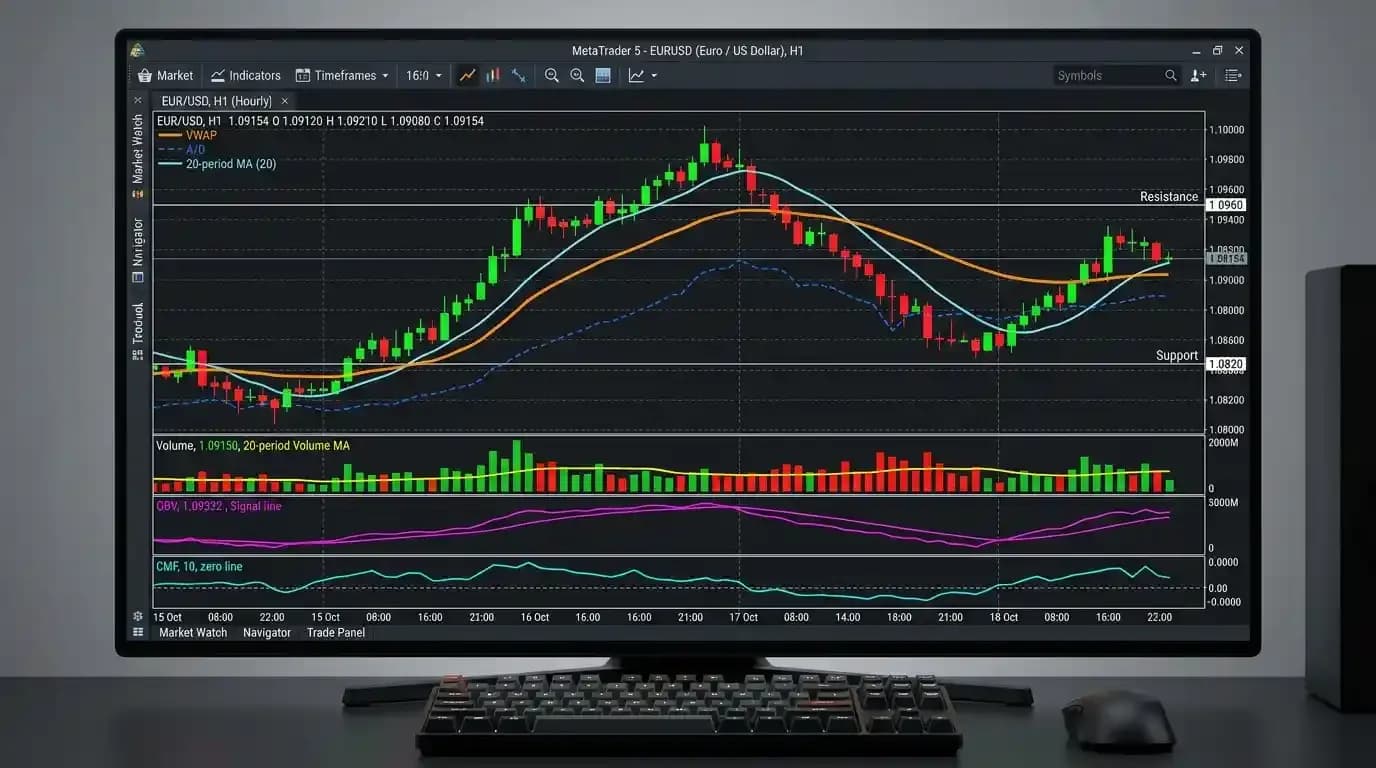
Traders using the MetaTrader 5 platform can analyze supported instruments using clean candlestick charts, horizontal levels and trendlines.
Price action trading generally does not require a heavily customized chart. The essential information is usually visible through price itself.
A practical chart can contain the relevant timeframe, a few major support and resistance areas and perhaps one carefully chosen indicator if it adds useful context.
The goal is not visual minimalism for its own sake. It is to make important price relationships easier to see without unnecessary clutter.
Platform Time and Price Action
MetaTrader charts can use server time that differs from Pakistan Standard Time. This matters because candle boundaries affect the appearance of intraday price action.
A four-hour structure on one platform may look slightly different from the same market on another if their candles start and end at different times.
The underlying price movement can be broadly identical while the visual swing sequence differs.
Traders comparing screenshots should therefore check chart time, timeframe and data feed before assuming one interpretation is incorrect.
Price Action for Traders in Pakistan
Price action trading principles do not change for traders in Pakistan, but session timing affects when important market movement occurs.
European forex activity becomes significant during Pakistan's daytime, while US market participation usually becomes more important later.
A trader following EUR/USD may therefore see quiet compression early in the day followed by stronger expansion as London becomes active.
Understanding these session differences can help explain why certain levels break during one period but remain untouched during another.
The method remains based on price; the local schedule determines when the most active price action is likely to occur.
Price Action for Traders in Khyber Pakhtunkhwa
For traders in Peshawar, Mardan, Abbottabad, Swat, Nowshera, Kohat, Bannu, Haripur, Mansehra, Swabi and other parts of Khyber Pakhtunkhwa, the most practical price action timeframe depends on how frequently charts can be monitored. Someone who checks the market occasionally may find four-hour or daily structure more manageable, while a trader actively watching European forex activity during Pakistan's daytime may prefer shorter timeframes.
Connectivity also matters. A setup based on a five-minute break of structure can develop and fail rapidly. A four-hour setup generally gives more time to observe changes, though it still carries market risk.
The trading method should fit practical circumstances rather than requiring constant screen time that the trader cannot realistically maintain.
Price Action Mistakes
Price action mistakes often come from excessive interpretation rather than lack of information. Traders may mark every tiny swing as structural, label every wick a liquidity sweep, call every breakout a break of structure and redraw levels repeatedly until the chart supports the desired trade. Others remove all indicators but then replace them with dozens of subjective lines and annotations, creating even more complexity than before.
A better price action framework uses a small number of meaningful structural points. The trader should know which highs and lows matter, why a level is important and what specific movement would invalidate the current interpretation.
Clarity comes from consistent rules, not from giving every candle a specialized label.
Overcomplicating Market Structure
Market structure can become unnecessarily complex when traders create too many classifications for minor price movement.
Suppose EUR/USD is clearly in a daily uptrend. On the five-minute chart, price produces several tiny lower highs and higher lows during ordinary intraday noise.
Trying to label every one as a major structural event can obscure the larger picture.
Structure should be analyzed at the scale relevant to the trading decision.
A swing trader may care primarily about daily and four-hour highs and lows, while a scalper may legitimately focus on smaller movements.
The important point is consistency.
Forcing Break of Structure Signals
A break of structure should involve an important level, not simply any candle high or low.
If a trader wants to buy EUR/USD, it becomes easy to select a tiny intraday high, wait for price to move one pip above it and declare bullish confirmation.
This makes the concept meaningless.
A legitimate structural break should relate to a swing point that actually influenced the preceding market sequence.
The trader should be able to explain why the level mattered before it broke.
Calling Every Wick a Liquidity Sweep
Long wicks are common in active markets. They can occur because price briefly moved through an area and then reversed, but not every wick needs an elaborate explanation.
Suppose gold produces a long upper shadow during highly volatile trading. The defensible observation is that higher prices were rejected during that period.
There may have been stop triggering or rapid order flow around the level, but the chart alone does not reveal every participant's intention.
Price action analysis becomes stronger when it distinguishes observable evidence from speculation.
Ignoring Higher-Timeframe Structure
A lower-timeframe bullish signal can fail quickly when it forms against powerful higher-timeframe structure.
Suppose the daily GBP/USD chart is in a strong downtrend and price is approaching major daily resistance. On the five-minute chart, a small bullish change of character occurs.
That does not automatically invalidate the daily downtrend.
The five-minute signal may simply represent a temporary recovery into resistance.
Traders should therefore understand which timeframe controls the trade horizon.
Lower-timeframe precision is useful only when broader context is respected.
Entering After Price Has Already Expanded
Price action traders sometimes wait for so much confirmation that they enter only after a large move has already occurred.
Suppose EUR/USD breaks resistance, retests it, forms a higher low and then rallies another 80 pips. The trader finally enters because the bullish structure now looks obvious.
The problem is that nearby resistance may be close and the logical stop may be far below the current price.
The analysis can be correct while the entry is poor.
Price action trading should evaluate location as well as direction.
Confirmation Bias
A trader who wants to buy can almost always find bullish price action somewhere on a sufficiently small timeframe. A trader who wants to sell can do the same with bearish structure.
Confirmation bias occurs when the chart is interpreted only in ways that support the existing opinion.
A disciplined trader asks what evidence would invalidate the bullish case, what supports the bearish case and which structural level would change the interpretation.
Price action should test beliefs rather than justify them.
Price Action and Risk Management
Price action can provide logical invalidation points, but it cannot determine appropriate financial exposure by itself.
Suppose EUR/USD forms a bullish setup with an important structural low 45 pips below the proposed entry. If that low defines where the bullish thesis becomes invalid, the position should be sized around the 45-pip distance rather than using an arbitrary tight stop simply to increase leverage.
A technically attractive setup can still fail.
The trader should determine how much money would be lost if the invalidation occurs and keep that exposure within an acceptable limit.
Strong price action does not justify excessive position size.
A Practical Bullish Price Action Example
Suppose EUR/USD is in a four-hour uptrend. The pair reaches a high of 1.1100, pulls back toward 1.1010 and begins stabilizing above an earlier structural low at 1.0980. On the one-hour chart, price initially produces lower highs during the pullback, but the decline gradually loses strength.
EUR/USD then breaks above the latest one-hour lower high at 1.1045. The move represents a short-term change in character while the larger four-hour bullish structure remains intact. Price later pulls back toward 1.1045, holds above the level and forms another higher low.
The trader now has a coherent scenario: higher-timeframe uptrend, controlled pullback, lower-timeframe structural shift and successful retest.
The setup can still fail if EUR/USD breaks the important higher-timeframe support.
A Practical Bearish Price Action Example
Suppose GBP/USD has been trending upward but approaches major resistance around 1.3000. Price trades briefly above the level to 1.3030 but closes back below it. The breakout has failed.
On the one-hour chart, GBP/USD then breaks below the latest meaningful higher low at 1.2940. A subsequent recovery reaches only 1.2970 before sellers return, creating a lower high.
The market has now produced rejection above resistance, a structural break lower and a failed recovery.
This is stronger bearish evidence than the original upper wick alone.
If GBP/USD later moves back above 1.3030, the bearish interpretation would need to be reconsidered.
A Practical Range Example
Suppose gold has been trading between support at 2,450 and resistance at 2,500 for several sessions. Price repeatedly rejects both boundaries while movement in the center of the range remains inconsistent.
A price action trader recognizes that neither side has established directional control.
Instead of trading every small movement inside the range, the trader focuses on the boundaries.
Gold eventually breaks above 2,500 and closes at 2,515. It then returns toward 2,500 but fails to move back inside the previous range.
The successful retest provides evidence that the former resistance may now be acting as support.
If gold had fallen directly back below 2,500, the breakout would have been far less convincing.
A Practical Failed Breakout Example
Suppose EUR/USD has resistance at 1.1200. Price rises rapidly to 1.1230 during an active session, but the breakout does not hold. The candle closes at 1.1180.
The next period forms a lower high around 1.1195 and then falls below short-term support at 1.1150.
The sequence contains several price action clues: a breakout attempt, rejection above resistance, a lower high and a subsequent support break.
A trader can interpret this as a failed bullish breakout followed by bearish structural confirmation.
The important point is the sequence, not one isolated wick.
Building a Price Action Trading Routine
A practical price action routine starts with the higher timeframe. Identify the dominant trend or range and mark only the most meaningful highs, lows, support and resistance areas. Move to the trading timeframe and observe how price behaves as it approaches those areas. Determine whether movement is expanding or compressing, whether important structure is holding and whether any breakout is being accepted or rejected. If a lower timeframe is used for entry, wait for a clear structural event rather than reacting to random candle noise. Before entering, define the exact market behavior that would invalidate the idea and calculate position size from that risk.
The process should remain simple enough that the trader can explain the setup without relying on vague terms. If the analysis requires constantly redrawing levels or changing definitions after price moves, the method has become too subjective.
Price Action Trading Guide FAQs
What is price action trading?
Price action trading is a method of analyzing market movement primarily through highs, lows, trends, support, resistance, breakouts, pullbacks and other visible price structures.
Does price action trading use indicators?
It can, but indicators are usually secondary. Many price action traders rely primarily on the chart itself and use only a small number of additional tools when helpful.
What is market structure?
Market structure describes how meaningful highs and lows develop, including higher highs and higher lows in uptrends and lower highs and lower lows in downtrends.
What is a break of structure?
A break of structure occurs when price moves beyond an important structural high or low.
What is a change of character?
A change of character generally describes an early structural shift against the direction of the previous trend.
Is break of structure the same as change of character?
Not exactly. Break of structure often refers to continuation, while change of character usually describes an early opposing break, though terminology can vary.
What is price compression?
Price compression occurs when ranges contract and price becomes increasingly confined.
What is price expansion?
Price expansion occurs when ranges widen and market movement becomes larger after quieter conditions.
What is a failed breakout?
A failed breakout occurs when price moves beyond support or resistance but cannot maintain trading outside the previous structure.
What is a liquidity sweep?
The term is commonly used when price trades beyond an obvious high or low and then reverses. The chart itself primarily shows a temporary break and rejection.
What is a fair value gap?
A fair value gap commonly refers to an area created during rapid directional movement where consecutive candles show relatively limited overlap under commonly used definitions.
Do fair value gaps always fill?
No. Price is not required to return to every gap-like area.
Is price action better than indicators?
Neither approach is universally better. Price action provides direct chart information, while indicators can help quantify trend, momentum, volatility or participation.
Can price action predict reversals?
It can help identify structural changes, but it cannot predict reversals with certainty.
How do I identify an uptrend with price action?
An uptrend generally forms a sequence of higher highs and higher lows.
How do I identify a downtrend?
A downtrend generally contains lower highs and lower lows.
What is price acceptance?
Price acceptance describes market behavior where price breaks into a new area and remains there rather than immediately reversing.
What is price rejection?
Price rejection occurs when price tests an area but fails to maintain trading there and moves back away.
Does a long wick mean reversal?
No. A wick shows rejection during one period, but the broader structure and subsequent price behavior determine whether a reversal develops.
Are price action patterns useful for forex?
Yes. Forex markets frequently develop trends, ranges, breakouts and structural shifts that can be analyzed directly from price.
Can price action be used for gold?
Yes. Gold often forms clear structural reactions, though its volatility can cause rapid failures and large wicks.
Can price action be used for indices?
Yes. Traders can study market structure, opening ranges, breakouts and reversals in supported index markets.
Can price action be used for cryptocurrency markets?
Yes. The same structural principles apply, although large volatility can make lower-timeframe signals noisier.
Which timeframe is best for price action trading?
There is no universal best timeframe. The appropriate choice depends on trading horizon, monitoring ability and market conditions.
Should I use multiple timeframes?
Multiple timeframes can help connect broader structure with more detailed entry information, but too many timeframes can create conflicting signals.
Does price action work differently in Pakistan?
No. The underlying price behavior is global. Traders in Pakistan mainly need to consider international session timing and platform chart time.
Is price action different for traders in KPK?
No. A trader in Peshawar, Mardan, Abbottabad, Swat or another KPK location can use the same market-structure principles. Local schedule and connectivity mainly affect practical timeframe selection and execution.
Can price action eliminate false signals?
No. Breakouts, structural shifts and support or resistance reactions can all fail.
Can price action trading guarantee profitable trades?
No. Price action describes market behavior and helps organize scenarios, but markets remain uncertain and leveraged positions can magnify losses.
Disclaimer: Price action concepts such as market structure, break of structure, change of character, compression, expansion, failed breakouts and support or resistance are interpretations of historical and current market behavior rather than guarantees of future direction. Structural signals can fail, volatility can change abruptly and unexpected events can invalidate technically reasonable setups. Leveraged positions may substantially increase losses when price moves against a trade. This material is provided for general educational purposes and is not personalized investment, trading, financial, legal or tax advice. Medatiq's supported instruments, spreads, execution conditions, margin requirements and platform functionality may vary or change.
Trade forex, gold, and indices with Medatiq Markets
Enjoy tight spreads and fast execution, built for market condition.