Volume Indicators in Trading: Complete Guide
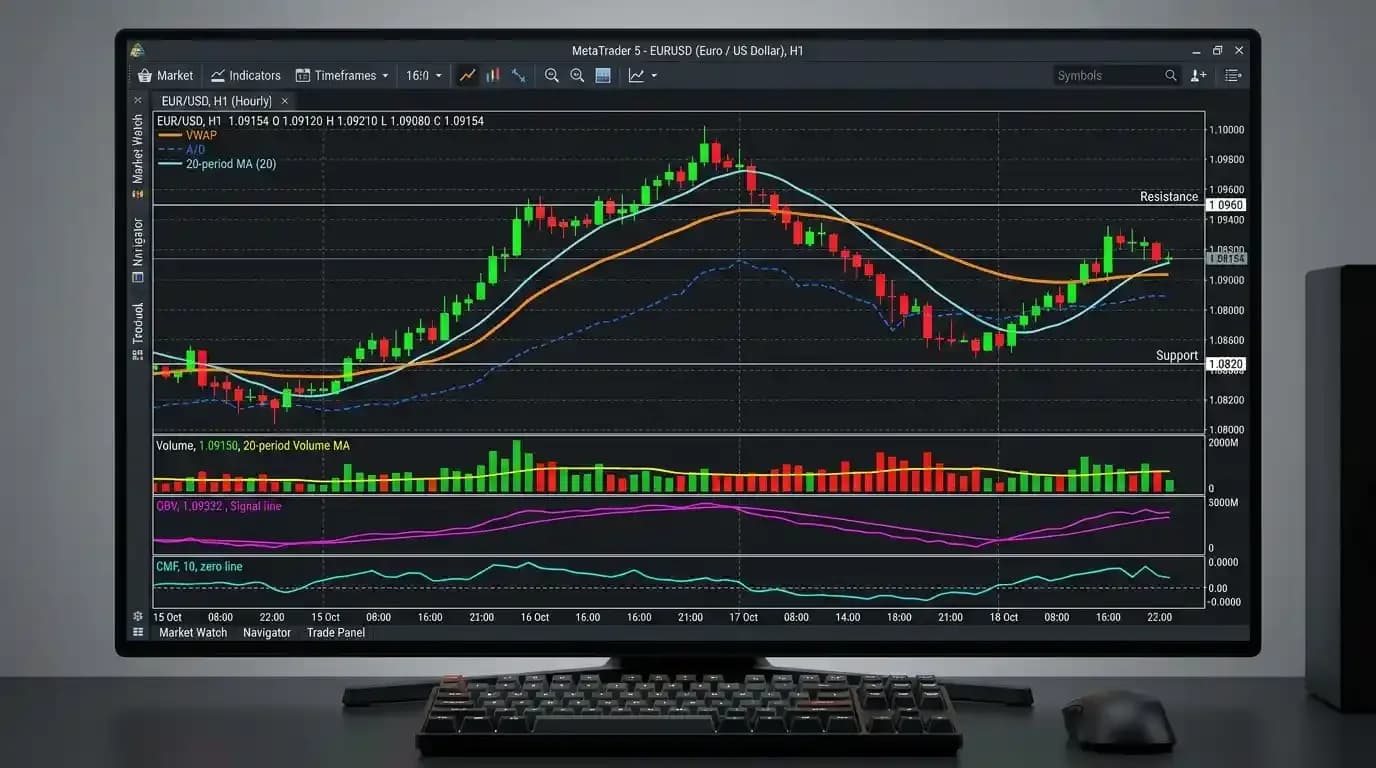
Volume indicators in trading help traders study market participation rather than looking at price movement alone. A price chart can show that EUR/USD, gold or an index is rising, but volume-related tools attempt to answer a different question: how much trading activity or participation appears to accompany that movement? Strong price movement backed by expanding participation can look very different from a move that continues while activity weakens. Volume indicators trading techniques are therefore commonly used to evaluate breakouts, trends, reversals, accumulation, distribution and the strength behind directional moves. The most widely followed tools include On-Balance Volume, VWAP, Accumulation/Distribution, Chaikin Money Flow, Force Index and Ease of Movement. Their interpretation depends heavily on the market being traded because not every instrument provides the same type of volume data. In centralized exchange-traded markets, actual traded volume may be available, while decentralized foreign exchange commonly relies on tick-volume information from a particular price feed rather than one complete global volume total. Volume indicators should therefore be treated as analytical context rather than proof that a market must continue in one direction.
The broader principles of technical analysis for trading help explain why participation matters. Price tells traders where the market has moved, while volume-related information can provide additional perspective on how much activity accompanied that movement. This distinction becomes particularly useful when a trader wants to judge whether a breakout appears broadly supported, whether momentum is weakening during a trend, or whether buyers and sellers are becoming more active near an important level.
What Is Volume in Trading?
Volume broadly refers to trading activity over a specified period, but the exact meaning depends on the instrument and market structure. In a centralized exchange, volume can represent the number of shares, contracts or units actually traded during a candle or session. If one million shares change hands during a period, the exchange can record that transaction activity directly. Foreign exchange is different because the spot forex market is decentralized. There is no single exchange that records every EUR/USD transaction globally, so retail trading platforms commonly show tick volume or activity derived from their particular price feed rather than a universal global transaction count.
This difference is important because traders should understand what their volume indicator is actually measuring before interpreting the signal. A strong volume spike on an exchange-traded instrument may represent a genuine increase in reported transactions, while a forex volume spike may represent a significant increase in quote or tick activity from the available feed. Both can still be analytically useful, but they are not identical datasets.
The wider topic of volume indicators trading therefore begins with data interpretation rather than signal memorization. A trader who does not know whether a platform is displaying actual volume, tick volume or another participation measure can easily draw conclusions that the data does not support.
Why Volume Matters
Price can move because buying and selling orders are being matched at progressively different levels, but the amount of activity surrounding that movement can provide useful context. Suppose an index breaks above an important resistance area and trading activity increases sharply at the same time. Traders may interpret the combination as stronger evidence of participation than a breakout that occurs during unusually quiet conditions. The higher activity does not guarantee continuation, but it suggests that more transactions or market interactions accompanied the move.
The opposite can also matter. Imagine price continues rising while volume participation steadily declines. The market is still moving upward, but fewer transactions or ticks may be supporting each successive advance. This can sometimes indicate weakening participation, although it should not be interpreted as an automatic reversal signal. Markets can continue trending for a considerable period even when volume declines, particularly when liquidity conditions, session timing or instrument characteristics change.
Volume becomes most useful when combined with visible market structure rather than treated as a standalone predictor. A trader studying candlestick patterns, support, resistance or breakouts can use participation data to ask whether market activity broadly confirms what price appears to be doing.
Volume and Liquidity Are Related but Different
Volume and liquidity are frequently confused. Volume measures trading activity, while liquidity describes how easily transactions can occur without causing a large change in price. A market can have high volume and generally strong liquidity, but the relationship is not perfect. Liquidity also depends on available order depth, bid-ask conditions, market structure and the distribution of orders at different prices.
During an important economic announcement, EUR/USD may experience a burst of extremely high activity while spreads widen and prices move rapidly. Activity is high, yet execution conditions may temporarily become less predictable. Similarly, a market can record moderate volume but still maintain orderly liquidity if buyers and sellers are consistently available near current prices.
Understanding this distinction matters because a volume indicator cannot fully describe execution quality. Traders considering entry and exit conditions should evaluate volume alongside spread, volatility and market structure rather than assuming high activity automatically means smooth execution.
Volume Indicators vs Price Indicators
Most technical indicators fall into broad functional categories. Some measure trend, some measure momentum, others measure volatility, and volume indicators focus primarily on participation or transaction-related activity. A moving average summarizes price direction. An oscillator may measure the speed of price change. A volatility indicator such as ATR measures the size of recent price ranges. A volume indicator attempts to show whether participation is expanding, contracting or behaving differently from price.
This distinction explains why volume indicators can complement other technical tools. If a trader is already using moving averages trading to identify trend, another moving average may add little new information. A volume-based tool, however, may contribute a different perspective by showing whether participation is strengthening or weakening during that trend.
This is also why combining unrelated measurements can be more informative than stacking several indicators built from almost the same price data. The trader still needs to understand that all indicators have limitations, and none becomes predictive simply because several tools are displayed together.
Actual Volume and Tick Volume
Actual traded volume is generally available in centralized markets where transactions are recorded by an exchange. Stock exchanges and futures markets can report how many shares or contracts traded during a period. This creates a direct transaction measure.
Tick volume counts how frequently price updates or changes occur over a specified interval. It does not represent the exact number of units traded. In spot forex, this type of data is widely used because the decentralized market does not provide one consolidated global transaction total to retail platforms.
Suppose one five-minute EUR/USD candle records 400 ticks and another records 1,200. The second period contains substantially more quote or price-update activity from the available feed. Traders may interpret this as greater market participation or intensity, but they should not describe it as exactly 1,200 currency transactions. The distinction is subtle but important.
Volume Bars
The simplest volume display appears as bars beneath a price chart. Each bar represents activity during the corresponding candle or period. Taller bars indicate higher recorded volume or tick activity, while shorter bars indicate lower activity.
A trader should generally compare volume with recent volume rather than focusing on an isolated absolute number. If typical activity is around 10,000 units and a candle suddenly records 60,000, the relative increase may be significant. If another instrument routinely trades several million units, a reading of 60,000 may be extremely low.
The relevant question is usually not, "Is this number high?" but rather, "Is this activity unusually high or low compared with the recent behavior of this same market and timeframe?"
Rising Price and Rising Volume
When price rises while participation also increases, traders often interpret the move as having broader support. Suppose an index moves above resistance while volume expands significantly relative to recent sessions. More participants appear to be active during the breakout, which may strengthen the technical case for continuation.
However, rising volume during an advance does not guarantee that buyers will remain in control. Extremely high activity can also appear near exhaustion points, major news events or institutional rebalancing. The meaning depends on where the volume occurs and how price behaves afterward.
Context is therefore essential. Rising price and rising participation inside a healthy trend can be constructive. The same volume surge after an already extreme move into major resistance may require a different interpretation.
Rising Price and Falling Volume
Price can continue higher while volume declines. This divergence may suggest that each new advance is attracting less participation, but traders should avoid jumping directly to a bearish conclusion. Low-volume advances can continue for longer than expected, particularly during holiday periods, quiet sessions or markets where available sellers are limited.
The more useful interpretation is that participation is not confirming the price advance as strongly as before. A trader can then watch whether price begins failing at resistance, momentum weakens or market structure changes. Volume becomes one component of the broader analysis rather than the reason for taking an immediate countertrend position.
Falling Price and Rising Volume
A decline accompanied by increasing volume can indicate strong selling activity. Suppose an index breaks below established support while trading activity expands sharply. The combination suggests that the breakdown has attracted meaningful participation.
Again, this does not mean price must continue falling. A large volume surge can also occur during capitulation, when intense selling is followed by a reversal. Traders should therefore observe what happens after the expansion. If price remains below support and continues forming lower highs, the bearish interpretation strengthens. If the market quickly recovers above the broken level, the breakdown may have failed despite the high activity.
Falling Price and Falling Volume
A decline on diminishing volume can indicate that selling participation is weakening. This can occur during an ordinary pullback within an uptrend, where fewer participants are willing to sell as price retraces.
Suppose EUR/USD is in a broad uptrend and falls toward support while tick activity gradually declines. If buyers then return near support and activity expands as price rebounds, the sequence may support the interpretation that the decline was corrective rather than the start of a new downtrend.
The same pattern can still fail. Volume behavior should be interpreted alongside the sequence of highs and lows rather than treated as a complete trading system.
On-Balance Volume
The OBV indicator, or On-Balance Volume, attempts to combine price direction with volume into a cumulative line. The concept is straightforward: volume is added when price closes higher and subtracted when price closes lower.
A simplified calculation is:
If current close > previous close, OBV = previous OBV + current volume
If current close < previous close, OBV = previous OBV − current volume
If current close = previous close, OBV remains unchanged
The absolute numerical value is usually less important than the direction and structure of the OBV line. Traders may observe whether OBV is rising with price, falling with price or diverging from price.
How OBV Works
Suppose an instrument records these volume values:
Day 1 volume is 100,000 and price closes higher. OBV rises by 100,000. Day 2 volume is 150,000 and price closes higher again, so another 150,000 is added. Day 3 volume is 120,000 and price closes lower, so 120,000 is subtracted.
The result is a cumulative series reflecting whether volume has generally accompanied advancing or declining periods.
Because the calculation assigns an entire period's volume according to whether the close was higher or lower, OBV simplifies complex intraday trading activity into one directional measure. That simplicity can be useful, but it is also a limitation because it does not distinguish how buying and selling occurred within the candle.
OBV Confirmation
When both price and OBV trend upward, traders may see the indicator as confirming positive participation. If price makes higher highs and OBV also makes higher highs, the two series are moving broadly together.
If price rises while OBV begins falling, the trader may interpret the relationship as a warning that participation is weakening. This is called divergence.
An OBV indicator strategy can use trend confirmation, breakout confirmation or divergence, but the trader should avoid treating any single OBV movement as proof of future price direction.
OBV Divergence
Suppose EUR/USD price forms:
Previous high: 1.1050
New high: 1.1100
At the same time, OBV fails to exceed its previous peak.
Price has produced a higher high while the participation indicator has not.
This divergence can indicate that the latest advance has weaker participation according to the OBV calculation.
The appropriate response is not necessarily to sell immediately. A trader can instead monitor whether price support fails, momentum weakens or a lower high develops. Divergence becomes more useful when price begins confirming the concern.
VWAP
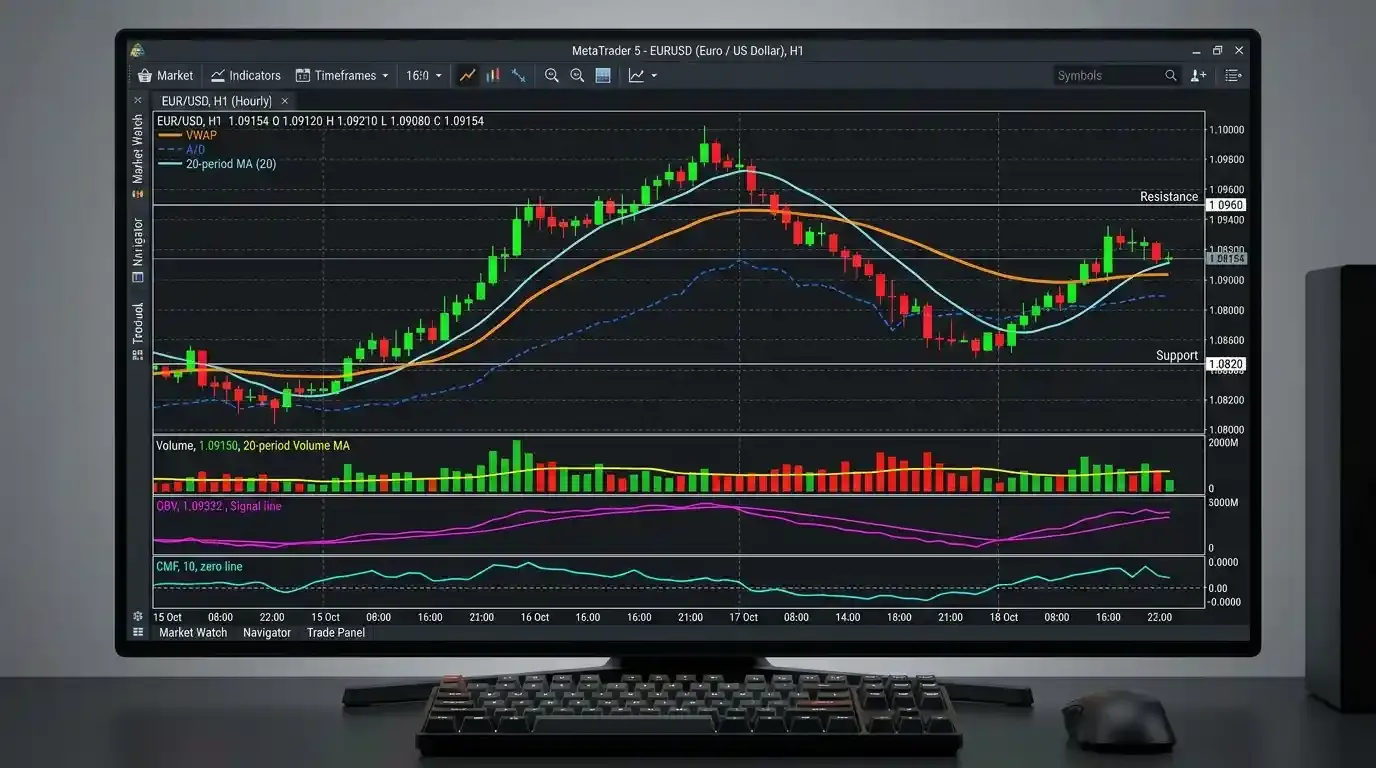
VWAP stands for Volume-Weighted Average Price. It calculates the average traded price over a period while weighting prices according to volume. Unlike a simple moving average, periods with greater volume have greater influence on the calculation.
A simplified formula is:
VWAP = Cumulative Price × Volume ÷ Cumulative Volume
More precisely, platforms commonly calculate a representative price for each period, multiply it by volume, sum those values and divide by cumulative volume.
The VWAP is widely followed in intraday trading because it provides a volume-adjusted reference for where trading activity has occurred during the session.
What VWAP Tells Traders
If price is trading above VWAP, the current market price is above the session's volume-weighted average. If price is below VWAP, it is below that average.
Some traders use this relationship as a directional or execution reference. A market holding above rising VWAP may appear stronger than one repeatedly failing below it.
However, VWAP is not an intrinsic-value calculation. Trading above VWAP does not mean an instrument is fundamentally expensive, and trading below it does not mean it is cheap. VWAP simply reflects the average price weighted by the recorded volume during the calculation period.
VWAP Example
Suppose an instrument trades during three simplified periods:
100 at volume 1,000
102 at volume 2,000
101 at volume 1,000
The volume-weighted calculation is:
(100 × 1,000) + (102 × 2,000) + (101 × 1,000) = 405,000
Total volume is:
1,000 + 2,000 + 1,000 = 4,000
Therefore:
VWAP = 405,000 ÷ 4,000 = 101.25
The period with the greatest volume has the strongest influence on the result.
This makes VWAP different from a simple arithmetic average of the three prices.
VWAP Strategy
A VWAP strategy can use VWAP as an intraday trend reference, pullback area or mean-reversion tool. The interpretation depends on the broader market environment.
In a strong uptrend, a trader might watch whether price repeatedly remains above VWAP and rebounds after temporary pullbacks. In a range, price may cross above and below VWAP frequently, reducing its directional usefulness.
The same indicator can therefore behave very differently across market regimes. Traders should identify whether the market is trending, ranging or experiencing a high-volatility event before assigning significance to every VWAP interaction.
Accumulation/Distribution Indicator
The accumulation distribution indicator attempts to combine price position within a period's range with volume. Rather than simply classifying a candle as up or down, it considers where the close occurred relative to the high and low.
A close near the high of the range can imply stronger buying pressure for that period. A close near the low can imply stronger selling pressure. Volume is then incorporated into the calculation.
The resulting cumulative line can be compared with price to evaluate whether participation broadly supports the market trend.
Accumulation and Distribution
The terms accumulation and distribution are often used to describe periods in which buying or selling appears to be occurring beneath the surface.
Accumulation generally refers to persistent buying activity, while distribution generally refers to persistent selling.
A trader should be cautious about assuming that one indicator can definitively identify institutional accumulation or distribution. Technical calculations can show relationships between price and volume, but they do not reveal the identity or intentions of every market participant.
The more defensible interpretation is that the indicator suggests whether closing behavior and volume are leaning toward buying or selling pressure according to its formula.
Chaikin Money Flow
Chaikin Money Flow uses price position within the high-low range and volume to estimate buying and selling pressure over a selected lookback period. It commonly oscillates around zero.
Positive readings generally indicate that price has tended to close toward the upper part of its ranges while volume is relatively strong.
Negative readings generally indicate more closing activity toward the lower parts of ranges.
A move above or below zero can provide directional participation context, but the signal should be evaluated alongside price structure. Chaikin Money Flow can oscillate frequently in sideways markets, creating misleading short-term signals if used without broader context.
Chaikin Money Flow Example
Suppose gold repeatedly closes near the upper portion of its daily range while trading activity increases. Chaikin Money Flow may move into positive territory.
If price is also making higher highs and higher lows, the indicator can support the bullish interpretation.
Now suppose gold continues making new highs while Chaikin Money Flow begins declining. This divergence may suggest weaker participation behind the advance.
The trader can then watch whether support breaks or price structure deteriorates before making a stronger conclusion.
Force Index
The Force Index attempts to combine price change and volume.
A simplified form is:
Force Index = (Current Close − Previous Close) × Volume
If price rises strongly on high volume, the indicator can produce a large positive value.
If price falls sharply on high volume, the result can be strongly negative.
This creates a direct relationship between the magnitude of the price change and the amount of trading activity.
Because raw Force Index can be volatile, traders often apply smoothing to make broader trends easier to interpret.
Interpreting Force Index
A positive Force Index indicates upward price change multiplied by volume. A negative reading reflects downward price change.
The magnitude helps show how powerful the move appears according to the calculation.
Suppose two sessions each gain 1%, but the second session trades twice as much volume. Force Index will generally assign greater strength to the second move.
However, one extreme reading can result from unusual one-off activity. A trader should compare the signal with surrounding periods rather than assuming every large value represents a sustainable trend.
Ease of Movement
The Ease of Movement indicator attempts to relate price movement to volume. The basic idea is to assess how easily price moves given the amount of trading activity required.
A relatively large price movement occurring on comparatively low volume can produce a different reading from the same price movement accompanied by extremely high volume.
The indicator can help traders examine whether price appears to be moving freely or encountering greater resistance from participation.
As with other volume tools, it is better used as context than as a standalone entry signal.
Volume and Breakouts
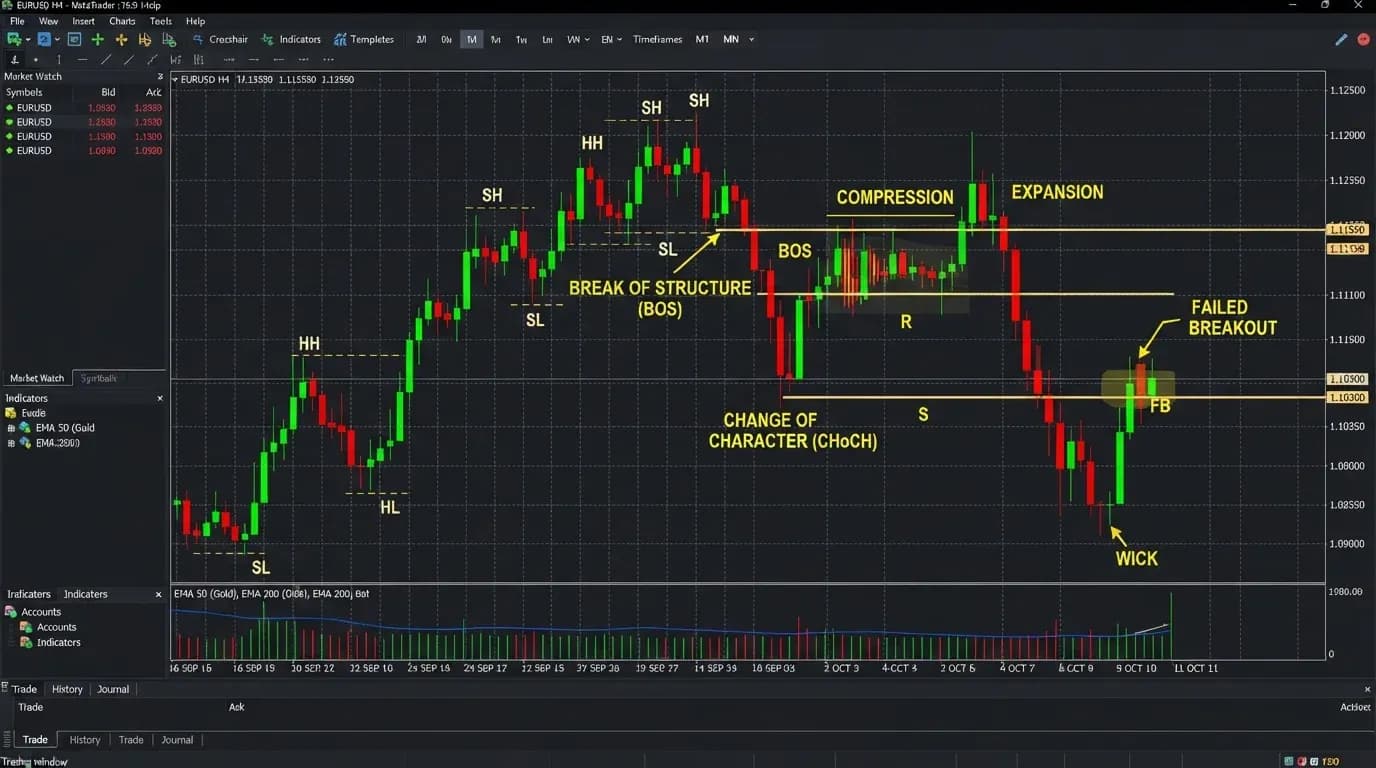
Breakouts are one of the most common uses of volume indicators trading analysis. Suppose an index has been trapped below resistance for several sessions. Price finally moves above the level.
If activity remains low, the trader may question whether the breakout has broad participation.
If volume expands sharply and price remains above the level, the move may appear more convincing.
The critical phrase is "may appear." Even high-volume breakouts can fail. News events, stop triggering and short-term speculative activity can produce intense volume followed by rapid reversals.
Volume can strengthen the evidence, but it cannot guarantee the outcome.
Low-Volume Breakouts
A breakout occurring on relatively low participation can be interpreted cautiously, especially if the market soon returns toward the broken level. Low volume may indicate limited commitment behind the move.
However, low volume does not automatically mean a breakout will fail. Some markets can move significantly when available liquidity is thin because relatively little trading activity is needed to push price through several levels.
This is another example of why volume and liquidity cannot be treated as identical concepts.
A trader should observe what happens after the breakout rather than using volume as the only test of validity.
High-Volume Breakouts
A high-volume breakout can indicate significant market participation. If price moves beyond resistance, activity expands and the market then holds above the breakout area, several pieces of evidence support continuation.
The more important test often comes afterward. Does the market maintain the breakout? Does old resistance begin acting as support? Does volume remain healthy during continuation rather than appearing only during one isolated spike?
A breakout that immediately reverses despite enormous volume can become a powerful warning that the initial move was absorbed or rejected.
Volume and Support and Resistance
Volume can help traders study how the market behaves near important price areas. Suppose EUR/USD approaches resistance and activity increases with each test. This can indicate growing interest around the level.
If buyers eventually push through resistance on significantly greater participation, the breakout may attract attention.
If volume spikes at resistance but price repeatedly fails to advance, the activity could instead indicate strong opposition from sellers.
The same volume expansion can therefore support different interpretations depending on what price actually does.
Volume at Reversals
Large volume sometimes appears near important market turning points. A prolonged decline can end with intense selling activity as participants exit positions simultaneously. Price may then stabilize and reverse.
This is sometimes described as capitulation.
The opposite can occur near market tops, where exceptionally high activity appears as late buyers enter while other participants distribute positions.
These patterns can be informative, but calling a top or bottom based only on a volume spike is dangerous. Extreme participation can also occur during the middle of a continuing trend.
Price confirmation remains necessary.
Volume During Pullbacks
Volume can provide useful information during corrections.
Suppose an index is in a healthy uptrend. Volume expands during advances and contracts during pullbacks. This pattern can suggest that the dominant participation is occurring in the direction of the broader trend.
If a later pullback develops on rapidly increasing volume, the character of the decline has changed. The trader may then pay closer attention to whether support fails.
The contrast between trend-leg participation and corrective participation can be more useful than one isolated volume reading.
Volume and Trend Confirmation
Volume indicators can be combined with trend indicators to evaluate whether directional movement has broad participation.
Suppose EUR/USD is above a rising moving average and producing higher highs. The trend is visibly bullish.
OBV also rises, and participation expands on major upward moves.
The volume data broadly confirms the price trend.
If the moving average remains bullish but OBV begins deteriorating for an extended period, the trader has conflicting information. The appropriate response may be greater caution rather than immediately reversing the position.
Volume and Moving Averages
Moving averages trading can show trend direction while volume helps assess participation.
Imagine price pulls back toward a rising 50 EMA on declining volume. Near the average, the market stabilizes. Price then begins rising while volume expands.
The combination can support the interpretation that the pullback attracted limited selling interest while renewed buying activity accompanies the continuation.
The moving average did not cause the rebound, and the volume did not guarantee it. Together, they provide two different forms of information.
Volume and Moving Average Crossovers
A moving average crossover strategy can sometimes be combined with participation data.
Suppose a faster moving average crosses above a slower one while volume expands. The crossover confirms that recent prices have strengthened, while the volume increase suggests greater activity during the transition.
If the crossover occurs during extremely quiet conditions, the signal may deserve more caution.
However, adding volume does not eliminate the fundamental weakness of crossovers in sideways markets. Price can still reverse and produce a whipsaw.
Volume and Volatility
Volatility indicators measure the size or variability of price movement, while volume indicators measure activity or participation. The two can rise together, but they do not always.
A major economic release can produce high volume and high volatility.
A thin market can produce high volatility on relatively low participation because available liquidity is limited.
A heavily traded but balanced market can record high volume while price remains relatively stable.
Understanding the difference prevents traders from assuming that every volume spike must correspond with a large directional move.
Volume and Momentum
Momentum measures the strength or speed of price movement. Volume measures participation.
Suppose EUR/USD accelerates upward while volume expands. Momentum and participation are both increasing.
Now suppose EUR/USD continues rising, but momentum slows and volume declines. The trend may still be upward, but both supporting measurements have weakened.
This can justify closer observation, particularly near resistance.
The market may consolidate, pull back or reverse, but the indicators cannot determine which outcome will happen with certainty.
Leading vs Lagging Indicators
The distinction between leading vs lagging indicators matters when interpreting volume tools. Many volume indicators are calculated from data that has already occurred, so they do not truly know future price behavior.
Some traders describe divergences or extreme readings as "leading" because they sometimes appear before visible price reversals. That does not mean the indicator possesses future information.
The signal is still derived from current and historical market activity. It can provide an early warning, but the warning may be wrong or persist much longer than expected.
Volume and Indicator Divergence
Divergence occurs when price and an indicator behave differently. For example, price may make a higher high while OBV forms a lower high.
This relationship can suggest that the price advance is not being confirmed by participation.
Divergence can also appear with Accumulation/Distribution, Chaikin Money Flow or other participation measures.
The broader concept of indicator divergence should be interpreted cautiously because divergences can persist during powerful trends.
A warning signal becomes more meaningful when market structure begins changing in the same direction.
Volume Divergence Example
Suppose gold rises from 2,450 to 2,500 and later reaches 2,530.
Price makes a new high.
OBV, however, peaks during the first advance and remains below that peak during the move to 2,530.
The trader can interpret this as weaker participation according to the indicator.
If gold then breaks short-term support and forms a lower high, the divergence has gained price confirmation.
If gold continues rising and OBV eventually reaches new highs as well, the warning was premature.
This example illustrates why volume divergence should not be used as a guaranteed reversal signal.
Volume Climax
A volume climax describes an exceptionally high level of activity relative to recent history.
It can appear during panic selling, aggressive buying, major news or a late-stage trend.
A climax is important because it shows that unusual participation occurred, but the direction of the next move remains uncertain.
Suppose an index falls sharply on record-high volume and then recovers before the session closes. This may indicate that intense selling was absorbed by buyers.
If the index instead closes near its low and continues falling the next day, the same volume spike may represent strong bearish continuation.
Price response determines the interpretation.
Volume Dry-Up
Volume dry-up describes an unusually low level of activity.
It can occur during consolidation, holiday trading or periods when market participants are waiting for new information.
Low volume may precede a larger move, but it does not predict direction.
Suppose EUR/USD compresses below resistance while tick activity decreases steadily. Traders may recognize that participation is temporarily quiet.
If volume later expands as price breaks upward, the transition can support the breakout interpretation.
If expansion occurs during a downside break, the earlier low-volume period simply represented consolidation before a bearish move.
Volume Profiles and Price Location
Volume-profile concepts examine how much activity occurred at different price levels rather than only across time periods. This differs from conventional vertical volume bars, which show activity per candle.
A high-volume price area can indicate that substantial trading occurred around that level. A low-volume area can indicate relatively less activity.
Although these concepts can be useful, traders should understand the exact data source before drawing conclusions, particularly in decentralized markets.
Volume indicators trading analysis is strongest when the underlying dataset matches the question being asked.
Intraday Volume Patterns
Volume is not constant throughout the trading day. Many markets display recurring patterns of higher and lower activity.
Exchange-traded markets often become particularly active around the open and close.
Forex activity changes as Asian, European and North American sessions overlap.
This means a volume reading that appears unusually large during a quiet period may be completely normal during the busiest part of the day.
Comparing a current bar with recent bars at similar session times can therefore provide more meaningful context than comparing it blindly with the immediately preceding candle.
Session Effects in Forex
Forex trading activity changes significantly as major financial centers become active.
EUR/USD and GBP/USD often experience greater activity during European trading hours and the overlap between London and New York.
A trader in Pakistan following these markets may therefore see tick volume rise during the daytime and remain active into later hours as North American trading develops.
The volume indicator is responding to market participation, not the trader's geographic location.
Understanding session structure helps explain why certain periods routinely show higher activity than others.
Volume Indicators for Traders in Pakistan
Volume indicators trading principles are the same for traders in Pakistan as elsewhere, but local time affects when major international sessions occur. A trader in Pakistan may observe relatively quiet activity during one part of the day and much stronger participation as London or New York becomes active.
This matters especially for intraday strategies. A volume spike during a quiet session may look dramatic on the chart but still represent less participation than ordinary activity during a major overlap.
Rather than using one absolute volume threshold throughout the day, traders should understand how participation normally changes across the sessions they follow.
Volume Indicators for Traders in Khyber Pakhtunkhwa
A trader in Peshawar, Mardan, Abbottabad, Swat, Kohat, Nowshera, Mansehra or another part of Khyber Pakhtunkhwa sees the same underlying participation data as other users receiving the same market feed. The practical issue is whether the trader's schedule fits the market period being analyzed.
Someone following European forex activity during Pakistan's daytime may naturally encounter higher participation as London becomes active. A trader interested in US indices may see stronger activity later in the local day. Traders who cannot monitor fast intraday conditions continuously may find higher-timeframe volume analysis more manageable because the signals develop more slowly and are less dependent on minute-by-minute observation.
Volume and Connectivity
Volume-driven strategies can become highly active when participation suddenly expands. A breakout that begins slowly may accelerate quickly as more participants enter.
If a trader depends on rapid manual decisions, unstable connectivity can complicate execution during these periods. This is especially relevant for very short-term strategies where a few seconds or minutes can materially change entry conditions.
Using higher timeframes can reduce the need for constant reaction, though it does not eliminate market risk. A sensible approach should fit the trader's practical ability to monitor and manage positions.
Volume Indicators in Forex Trading
Volume indicators can be applied to forex trading, but traders should remember that spot forex volume on retail platforms is commonly tick-based rather than a complete global transaction count.
Tick activity can still be useful because periods of intense market participation tend to produce more price updates.
A forex trader may use volume data to assess whether a breakout is occurring during an active session, whether participation is increasing after an economic release or whether activity is declining during a pullback.
The interpretation should remain relative rather than assuming the displayed volume represents every forex trade worldwide.
Volume Indicators in Gold Trading
Gold can experience substantial participation changes around economic releases, interest-rate expectations and geopolitical developments.
A gold trader may observe a breakout from resistance accompanied by sharply increasing activity. This can indicate that the move has attracted broader participation.
However, gold can also experience extremely high activity near market turning points.
The trader should therefore examine whether price holds the breakout, whether volume remains healthy during continuation and whether market structure confirms the move.
One large volume bar alone cannot determine whether the market is beginning a trend or exhausting one.
Volume Indicators in Indices
Indices often show strong volume patterns around the underlying market open, major economic announcements and the end of the trading session.
A breakout occurring immediately after the US market opens may naturally involve much greater participation than movement during a quieter period.
For traders in Pakistan, this often means that some of the most active index conditions occur later in the local day.
Volume comparisons should therefore be made within appropriate session context rather than treating every hour as though participation should be identical.
Volume Indicators in Cryptocurrency Markets
Cryptocurrency markets operate continuously, but participation can still vary substantially by time, venue and market conditions.
Actual volume data can also differ between exchanges, which means one platform's reported volume may not represent the entire global cryptocurrency market.
A trader comparing crypto volume should understand which exchange, liquidity source or data feed the chart uses.
Sharp volume expansion during a breakout can be informative, but cryptocurrency markets can also produce rapid reversals after intense participation.
The same principles of confirmation and risk management remain necessary.
Volume Indicators on MetaTrader 5
Traders using MetaTrader 5 can study available market activity alongside price charts on supported instruments. The exact type of volume shown depends on the instrument and available feed.
Before interpreting any volume tool, confirm whether the platform is presenting actual traded volume, tick volume or another measurement.
The selected timeframe also matters. A one-minute volume bar and a daily volume bar summarize completely different amounts of market activity.
Indicator settings, market session and data source should therefore be understood before comparing readings.
Volume and Timeframes
Volume indicators behave differently across timeframes.
A five-minute chart shows short-term participation.
An hourly chart summarizes a much broader period.
A daily chart combines activity across an entire trading day according to the platform's candle construction.
Suppose volume spikes dramatically on a five-minute EUR/USD chart after economic news. The daily volume bar may also increase, but the short-term chart reveals exactly where the burst occurred.
Conversely, daily analysis can show whether the entire session was unusually active compared with previous days.
The right timeframe depends on the question being asked.
Multi-Timeframe Volume Analysis
A trader can combine several timeframes to place participation in context.
Suppose daily volume has been gradually increasing during a broader gold uptrend. On the four-hour chart, price then pulls back on declining activity. On the one-hour chart, volume begins expanding again as buyers return near support.
This sequence can support a continuation interpretation because the broader trend has healthy participation, the correction occurs on lower activity and the rebound attracts renewed volume.
The scenario can still fail, but multi-timeframe analysis explains how different layers of participation fit together.
Volume and Candlestick Patterns
Volume can add context to candlestick patterns.
Suppose a bullish reversal candle forms at major support.
If the candle appears during unusually high activity and price continues higher afterward, the reversal may look more significant than the same candle appearing during an extremely quiet period.
However, volume should not transform every recognizable candle into a trade.
Candlestick patterns themselves are simply descriptions of price behavior. Volume adds participation context but cannot guarantee that the pattern will succeed.
Volume Indicators and About Medatiq Markets
Traders comparing available markets and platform access can review information about Medatiq Markets, while the broader trading services area provides context on supported market categories.
The practical use of volume analysis depends on the instrument because forex, exchange-traded assets and other markets can provide different types of participation data. Traders should therefore understand the market structure behind the chart rather than assuming every volume indicator is built from identical information.
Common Volume Indicator Mistakes
One of the most common mistakes is assuming that high volume automatically means price will rise. High participation can accompany aggressive buying, aggressive selling or intense two-way trading. Another mistake is assuming low volume guarantees an imminent breakout. Quiet conditions can persist much longer than expected. Traders also frequently interpret forex tick volume as though it represented every currency transaction globally, or combine several volume indicators and treat them as independent confirmation even though they use similar underlying data.
A better approach is to ask what the indicator measures, whether participation is unusual relative to recent conditions, how price is behaving at the same time and whether the signal agrees with the broader trend or market structure.
Using Too Many Volume Indicators
Displaying OBV, Accumulation/Distribution, Chaikin Money Flow, Force Index and several other volume tools simultaneously can make the chart look sophisticated while adding surprisingly little information.
Many of these calculations begin with the same underlying price and volume data. Their signals will naturally overlap at times.
A cleaner approach is to choose one tool for the question being studied. OBV may be useful for cumulative participation trends. VWAP may be useful for an intraday volume-weighted price reference. Chaikin Money Flow may help evaluate the relationship between closing location and volume.
Understanding one indicator deeply is usually more useful than collecting several without knowing why they differ.
Volume Does Not Guarantee Breakout Quality
A high-volume breakout can fail.
This point deserves emphasis because traders often treat volume confirmation as though it eliminates uncertainty.
Suppose an index moves above resistance on extremely high volume. The move attracts many buyers.
Minutes later, price falls back below the breakout level.
The high volume now tells us that substantial participation occurred during a failed move.
The same indicator that initially appeared bullish becomes evidence of intense activity around a rejection.
Price behavior after the volume event determines the eventual interpretation.
Low Volume Does Not Automatically Mean Weak Price
A market can advance on low volume for structural reasons. If sellers are scarce, relatively modest buying demand may be sufficient to move price upward.
Likewise, low volume can occur during holidays or quiet sessions without necessarily changing the broader trend.
This is why volume should generally be compared with the market's own recent behavior and interpreted together with liquidity and session conditions.
A mechanical rule such as "low volume equals weak trend" is too simplistic for many real markets.
Volume Indicators and Risk Management
Volume indicators can improve analysis, but they do not determine how much money should be risked.
Suppose a breakout appears technically strong and volume expands sharply. The trade can still reverse immediately.
The trader therefore needs an invalidation level and a position size appropriate for the financial risk.
A strong volume signal is not a reason to increase leverage beyond normal risk limits.
If anything, extremely active conditions can produce larger price movements and more execution uncertainty, making disciplined exposure even more important.
A Practical Volume Breakout Example
Suppose EUR/USD has been trading below resistance around 1.1050. Tick activity has gradually declined as price compresses beneath the level. The market then breaks above 1.1050 during active European trading, and tick volume increases substantially relative to the preceding candles.
Price reaches 1.1080, then pulls back toward 1.1050. Volume declines during the pullback. Buyers reappear near the old resistance, and activity begins increasing as EUR/USD recovers.
The sequence provides several useful observations. The breakout attracted stronger participation, the pullback occurred with less activity, and buying interest returned near the former resistance.
None of these facts guarantees continuation. If EUR/USD later breaks decisively below the support area, the bullish interpretation needs to be reconsidered.
A Practical OBV Example
Suppose an index is making higher highs across several weeks. OBV also rises and repeatedly reaches new highs.
Price and participation broadly confirm each other.
Later, the index makes another record high, but OBV fails to exceed its previous peak and begins falling.
The divergence creates a warning.
If the index then breaks support and forms a lower high, the participation weakness has gained price confirmation.
If the index continues rising and OBV catches up, the divergence was temporary.
This is a more disciplined use of volume indicators than treating the first disagreement as a guaranteed market top.
A Practical VWAP Example
Suppose a US index opens at 5,000 and begins rising. VWAP gradually rises with it. Price remains above VWAP for most of the session, and temporary pullbacks repeatedly stabilize around the volume-weighted average.
This can indicate persistent intraday strength.
Later, price falls below VWAP, attempts to recover and fails. Market structure also shifts from higher lows to a lower high.
The change in VWAP behavior now supports what price is already showing.
The most useful signal comes from the combination rather than from one isolated VWAP cross.
A Practical Volume Analysis Routine
A useful volume indicators trading routine begins with price. First determine whether the market is trending, ranging or testing a major technical level. Then examine whether participation is expanding or contracting relative to recent conditions. If a volume indicator such as OBV, VWAP or Chaikin Money Flow is used, understand exactly what it measures and whether the data is actual traded volume or tick-based activity. Compare the indicator with market structure, volatility and session timing. Finally, define what price behavior would invalidate the interpretation and size the position accordingly.
This approach keeps volume analysis connected to real market behavior rather than reducing it to formulas such as "high volume means buy" or "low volume means sell."
Volume Indicators Trading FAQs
What are volume indicators in trading?
Volume indicators are technical tools that use trading activity, tick activity or related participation data to help traders evaluate the strength, confirmation or character of price movement.
What does high volume mean?
High volume means activity is elevated relative to the measurement being used. It can occur during bullish moves, bearish moves, reversals or major two-way trading.
Does high volume mean price will rise?
No. High volume measures participation, not future direction.
What does low volume mean?
Low volume indicates relatively quiet activity. It can occur during consolidation, quiet sessions, holidays or periods when traders are waiting for new information.
What is tick volume?
Tick volume measures the number or frequency of price updates or ticks during a period rather than the exact number of units traded.
Is forex volume real volume?
Retail spot forex platforms commonly use tick volume because spot foreign exchange is decentralized and does not have one global exchange reporting every transaction.
What is OBV?
On-Balance Volume is a cumulative indicator that adds volume on periods that close higher and subtracts volume on periods that close lower.
What is VWAP?
VWAP is the volume-weighted average price over a defined period and gives greater influence to prices where more volume was recorded.
Is VWAP the same as a moving average?
No. A conventional moving average weights prices according to its chosen formula, while VWAP specifically incorporates volume.
What is Chaikin Money Flow?
Chaikin Money Flow combines price position within each period's range with volume to estimate buying or selling pressure over a selected lookback period.
What is the Accumulation/Distribution indicator?
It is a cumulative volume-based indicator that considers where price closes within each period's high-low range.
What is Force Index?
Force Index combines price change and volume to estimate the strength of upward or downward price movement.
What is Ease of Movement?
Ease of Movement relates price movement to volume in an attempt to show how easily the market is moving.
Does rising volume confirm a breakout?
Rising volume can strengthen the evidence behind a breakout, but it cannot guarantee continuation.
Can a low-volume breakout succeed?
Yes. Low volume does not automatically mean a breakout will fail.
What is volume divergence?
Volume divergence occurs when price and a volume indicator move differently, such as price making a higher high while OBV fails to confirm it.
Does volume divergence guarantee a reversal?
No. Divergence can persist while the existing trend continues.
Are volume indicators useful for forex?
Yes, but traders should understand that forex platforms commonly display tick-based rather than consolidated global transaction volume.
Are volume indicators useful for gold?
Yes. Volume and participation tools can add context to gold trends, breakouts and reversals depending on the data source.
Are volume indicators useful for indices?
Yes. Volume is often particularly informative around index market opens, breakouts and major economic events.
Can volume indicators be used for cryptocurrency markets?
Yes, although reported volume can differ substantially between exchanges and data sources.
Which volume indicator is best?
There is no universally best indicator. OBV, VWAP, Chaikin Money Flow, Accumulation/Distribution and Force Index answer different questions.
Is VWAP useful for intraday trading?
VWAP is widely used as an intraday volume-weighted price reference, but price can cross it repeatedly during sideways conditions.
Can volume indicators predict reversals?
They can highlight unusual participation or divergence, but they cannot predict reversals with certainty.
Do volume indicators work differently in Pakistan?
The calculations do not change because of location. Traders in Pakistan mainly need to account for the timing of active international trading sessions.
Are volume indicators different for traders in KPK?
No. Traders in Peshawar, Mardan, Abbottabad, Swat or elsewhere in KPK receive the same calculation when using the same market data and settings. Local schedule and connectivity affect how short-term signals are managed.
Which timeframe is best for volume indicators?
There is no single best timeframe. The appropriate choice depends on whether the trader is analyzing intraday participation, swing trading activity or longer-term market behavior.
Why does volume differ between platforms?
Different exchanges, liquidity sources, price feeds and tick data can produce different volume measurements.
Can volume indicators guarantee profitable trading?
No. Participation signals can fail, volume spikes can occur at both continuation and reversal points, and leverage can magnify losses when price moves against the trade.
Disclaimer: Volume indicators such as OBV, VWAP, Accumulation/Distribution, Chaikin Money Flow and Force Index describe historical or current market activity and cannot guarantee future price direction. Volume data can differ by exchange, instrument, liquidity source or price feed, while spot forex commonly relies on tick-based activity rather than one complete global transaction count. Breakouts, divergences and high-volume moves can fail, and leveraged trading can produce substantial losses. This material is provided for general education and is not individualized investment, trading, financial, legal or tax advice. Medatiq's supported instruments, platform functionality, execution conditions, spreads and margin requirements may vary or change.
Trade forex, gold, and indices with Medatiq Markets
Enjoy tight spreads and fast execution, built for market condition.