Chart Patterns in Trading: Continuation & Reversal Guide
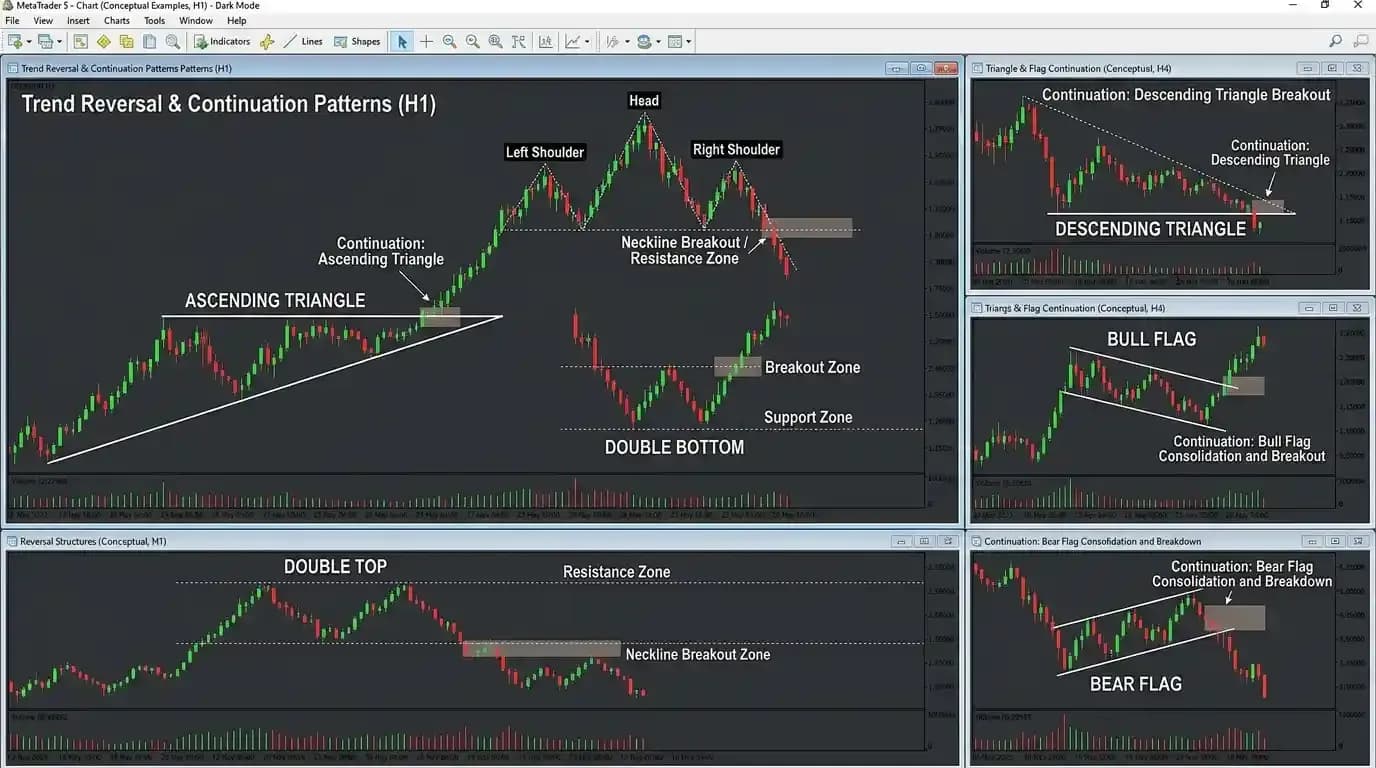
Chart patterns trading is the practice of studying recognizable price structures that develop as buyers and sellers interact over time. Unlike a single candlestick, a chart pattern usually develops across many candles and can show how price behaves around support, resistance, trend boundaries and periods of consolidation. Traders commonly group these structures into continuation patterns, which may develop while an existing trend pauses before potentially resuming, and reversal patterns, which may indicate that the balance between buyers and sellers is changing. Examples include triangles, flags, double tops, double bottoms and head-and-shoulders formations. These patterns can help traders organize possible breakout levels, invalidation points and market scenarios, but they cannot guarantee what happens next. A textbook-looking triangle can break in the opposite direction, a double top can fail when resistance is breached, and a flag can become a larger sideways range instead of continuing the earlier trend. The value of chart patterns comes from understanding the underlying price structure and defining conditional scenarios rather than assuming that a familiar shape predicts the future.
Chart patterns are one branch of technical analysis for trading. They build on concepts such as trend, market structure, candlestick patterns, support, resistance and volatility. A trader who understands why a pattern has formed is generally in a better position than someone who simply recognizes its outline.
What Are Chart Patterns in Trading?
Chart patterns are recurring arrangements of price movement that develop across multiple periods. They can form on forex pairs, gold, indices and other actively traded markets, and the same broad structures can appear on five-minute, hourly, four-hour or daily charts. The pattern is created by the sequence of highs, lows, support areas, resistance areas and directional swings rather than by one individual candle.
For example, suppose EUR/USD rises strongly, pauses for several sessions inside a narrow downward-sloping consolidation and then approaches the upper boundary of that consolidation. A trader may identify the structure as resembling a bull flag. The label is useful because it summarizes a particular type of trend-and-consolidation relationship, but the market is not required to complete the textbook outcome. Price can break upward, remain trapped in consolidation or reverse lower. The pattern becomes a framework for asking what would confirm continuation and what would invalidate it.
This is the central principle of chart patterns trading: patterns should organize decisions rather than replace judgment.
Why Chart Patterns Form
Chart patterns form because market participants do not all make decisions at the same moment or for the same reasons. Some traders take profits after a strong move, others enter on pullbacks, some place breakout orders around obvious highs and lows, and others wait for confirmation before becoming active. These decisions create repeated swings and zones where price temporarily balances before the next larger movement develops.
Imagine GBP/USD has been rising strongly. Early buyers begin taking profits, creating selling pressure. New buyers still view the broader trend as attractive and enter during the pullback. The result may be a relatively controlled consolidation instead of a full reversal. If buyers eventually overcome the temporary selling and price breaks above the consolidation, the earlier uptrend may continue. This type of interaction can create a flag or triangle.
A reversal pattern develops through a different shift in behavior. A market may repeatedly fail to produce meaningful new highs, sellers may become more aggressive near resistance, and eventually support can break. The completed structure can resemble a double top or head-and-shoulders formation. The pattern is therefore a visual consequence of changing market behavior, not a shape imposed on price from outside.
Continuation Patterns vs Reversal Patterns
Continuation patterns generally develop after an established directional move and represent a pause, compression or temporary countertrend phase. Bull flags, bear flags and some triangles are commonly interpreted this way. Their central idea is that the trend remains structurally intact while the market temporarily consolidates.
Reversal patterns suggest a possible transition from one directional structure to another. Double tops, double bottoms and head-and-shoulders formations are familiar examples. A reversal pattern typically becomes more meaningful when it develops after an identifiable trend rather than in the middle of an arbitrary range.
This distinction is useful but not absolute. An ascending triangle may appear during an uptrend and behave as a continuation pattern, but it can also develop in other environments. A double top may look bearish but fail when price later breaks above resistance. Traders should therefore evaluate the actual structure rather than assuming that classification alone determines the outcome.
Context Comes Before the Pattern Name
One of the biggest weaknesses in chart patterns trading is pattern hunting: finding a recognizable shape and then building an entire market forecast around it. A more disciplined process begins with context. Is the market trending or ranging? Where are the major support and resistance areas? Is the pattern forming after an extended move or inside a broad consolidation? Is volatility expanding or contracting? Is price approaching a major higher-timeframe level?
Suppose a small ascending triangle appears on a five-minute EUR/USD chart directly underneath major daily resistance. The lower-timeframe pattern may look bullish, but the higher-timeframe location introduces a significant obstacle. Compare that with the same structure forming after a healthy pullback inside a strong broader uptrend with no nearby major resistance. The shape may be similar, yet the surrounding conditions are very different.
The most useful chart patterns are therefore those that fit a coherent market story rather than those that merely resemble a diagram.
Support and Resistance Create the Pattern Boundaries
Most chart patterns can be understood through support and resistance. Horizontal resistance forms the upper boundary of an ascending triangle. Descending support helps define a descending triangle. The peaks of a double top mark repeated resistance, while the lows between those peaks create the neckline or confirmation area. A head-and-shoulders pattern is also defined through a sequence of highs and a support boundary connecting important reaction lows.
This means traders who understand support and resistance already possess much of the foundation needed for chart patterns trading. The pattern name simply describes the way those levels interact over time.
Rather than asking, "Is this definitely a triangle?" it is often more useful to ask, "Where are buyers repeatedly becoming active, where are sellers repeatedly stopping price, and which boundary would need to break for the current balance to change?"
Ascending Triangle Pattern
The ascending triangle pattern generally contains relatively horizontal resistance and progressively higher lows. The market repeatedly tests an upper boundary while buyers become willing to enter at increasingly higher prices during each pullback.
Suppose EUR/USD repeatedly fails around 1.1100. The first pullback reaches 1.1000, the next reaches only 1.1030 and a later pullback stops around 1.1060. Resistance remains near 1.1100, but the lows are rising. This structure can indicate increasing buying pressure beneath a fixed selling area.
A bullish breakout becomes more meaningful when price moves through resistance and can maintain trading above it. The pattern is not complete merely because the lines look triangular. If EUR/USD instead breaks the rising lower boundary and falls, the bullish interpretation has failed.
Why an Ascending Triangle Can Be Bullish
The logic behind an ascending triangle is more useful than memorizing its appearance. Each pullback stops at a higher level, suggesting that buyers are becoming increasingly willing to enter before price returns to previous support. Meanwhile, sellers repeatedly defend the same resistance area.
If the available selling interest around resistance is eventually absorbed, price may be able to break upward. This is why ascending triangles often receive a bullish interpretation.
However, the logic is probabilistic rather than deterministic. New sellers can enter, market conditions can change or an external event can reverse sentiment. An ascending triangle is therefore a structure that can favor an upside scenario without guaranteeing it.
The dedicated how to trade an ascending triangle pattern discussion can be used when the specific concern is execution rather than general pattern recognition.
Descending Triangle Pattern
The descending triangle pattern generally contains relatively horizontal support and progressively lower highs. Sellers become active at increasingly lower prices while buyers continue defending a similar support zone.
Suppose GBP/USD repeatedly finds support around 1.2700. The first rally reaches 1.2900, the next stops at 1.2830 and a later recovery reaches only 1.2770. Sellers are becoming active progressively earlier while support remains under repeated pressure.
A downside break through 1.2700 can confirm the bearish scenario if price sustains the move. If GBP/USD instead breaks above the declining sequence of highs, the expected bearish resolution has failed.
As with an ascending triangle, the shape provides a framework for evaluating the balance between buyers and sellers rather than a guaranteed direction.
Symmetrical Triangle Logic
A symmetrical triangle forms when highs become lower and lows become higher, causing the trading range to contract from both sides. Unlike ascending and descending triangles, neither side has an obvious horizontal boundary. Buyers and sellers are both becoming more selective, and volatility compresses as price approaches the narrowing part of the structure.
The direction of the preceding trend can provide context, but traders should not assume that every symmetrical triangle continues that trend. The market can break in either direction. A more disciplined approach is to identify both boundaries and wait for actual price behavior to reveal which side gains control.
Volatility often contracts as the triangle develops. The later breakout can therefore coincide with renewed range expansion. This relationship between compression and expansion is one reason chart patterns and volatility analysis work well together.
What Makes a Triangle Breakout More Convincing?
A triangle breakout becomes more meaningful when price moves decisively beyond the boundary rather than briefly trading outside it. A close beyond the level, subsequent continuation and a successful retest can all provide additional evidence. Participation can also be useful: if volume indicators trading data shows greater activity during the breakout, the move may appear more broadly supported.
None of these conditions guarantees success. A breakout can close beyond the pattern, attract strong participation and still reverse. Confirmation reduces some types of uncertainty but never removes market risk.
The trader therefore needs an invalidation point even when the breakout looks unusually strong.
Bull Flag Pattern
The bull flag pattern usually develops after a strong upward move followed by a relatively controlled consolidation or downward-sloping pause. The initial advance is sometimes called the flagpole, while the consolidation forms the flag.
The pattern receives a bullish continuation interpretation because the pullback is relatively contained compared with the preceding advance. Buyers have not necessarily disappeared; the market may simply be pausing while early participants take profits and new demand develops.
Suppose gold rises sharply from 2,450 to 2,520 and then spends several periods moving gradually down toward 2,495 without breaking important structural support. If price later breaks above the upper consolidation boundary, traders may interpret this as a possible resumption of the earlier uptrend.
If gold instead breaks decisively below the flag structure and important support, the continuation assumption is weakened.
The Importance of the Flagpole
The flagpole provides context because it shows the directional impulse that occurred before consolidation. A small sideways range without a meaningful preceding trend is not necessarily a flag.
A convincing bull flag typically begins after a noticeable advance. A convincing bear flag follows a meaningful decline. The consolidation should then represent a pause relative to the previous move rather than a completely new market structure.
This distinction prevents traders from labeling almost every small channel as a flag.
The stronger approach is to ask whether the market had a clear directional impulse, whether the correction remains controlled and whether the original trend structure remains intact.
Bear Flag Pattern
The bear flag pattern is the bearish counterpart. Price declines sharply, then experiences a relatively controlled upward or sideways correction before potentially resuming lower.
Suppose GBP/USD falls from 1.3000 to 1.2750 and then gradually rebounds toward 1.2820 inside a narrow upward-sloping channel. The recovery appears modest compared with the earlier decline, and the broader sequence still contains lower highs and lower lows.
If GBP/USD breaks below the lower flag boundary and resumes the decline, traders may interpret the movement as bearish continuation.
If price instead breaks above important resistance and begins establishing higher highs, the original bear flag scenario is invalidated.
Flags and Trend Quality
Flag patterns generally make more sense when they develop inside an identifiable trend. A bull flag against a powerful higher-timeframe downtrend deserves a different interpretation from one forming within a well-established uptrend.
This is where moving averages trading can add context. If price forms a bull flag while remaining above a rising medium-term average and holding higher lows, the broader directional structure supports the continuation case. A bull flag developing below a sharply declining moving average may instead be a short-term countertrend recovery that requires greater caution.
Indicators should not determine the pattern, but they can help show whether it aligns with or opposes the prevailing market direction.
Double Top Pattern
The double top pattern is a potential bearish reversal structure that forms when price makes two significant highs in approximately the same region with a meaningful decline between them.
Suppose EUR/USD rallies to 1.1200, falls to 1.1050 and later returns toward 1.1200 but fails again. The repeated inability to maintain prices above the resistance area suggests that buyers have not been able to establish a sustained breakout.
The pattern is not fully confirmed simply because two peaks exist. The low between them becomes important. If EUR/USD subsequently breaks below 1.1050, the bearish reversal interpretation gains structural confirmation because the market has broken support as well as failed at resistance.
If EUR/USD instead breaks decisively above 1.1200, the double-top thesis is invalidated.
Double Tops Do Not Require Identical Peaks
Real markets rarely produce two perfectly identical highs. One peak might reach 1.1200 and another 1.1215. Depending on volatility and timeframe, both can still belong to the same resistance zone.
Demanding pixel-perfect symmetry can cause traders to miss the underlying structure, while allowing unlimited variation makes the pattern meaningless. The solution is to consider whether both peaks represent reactions around the same technically relevant area.
The shape should follow the market structure, not the other way around.
Double Bottom Pattern
The double bottom pattern represents the opposite potential reversal. Price forms two meaningful lows around a similar support area with a recovery between them.
Suppose GBP/USD falls to 1.2500, rallies to 1.2650 and later returns toward 1.2500. Buyers respond again, preventing a sustained break lower.
The recovery high around 1.2650 becomes an important confirmation area. If GBP/USD later breaks above it, the market has not only rejected support twice but also overcome the intervening resistance.
A double bottom therefore represents more than two lows. The structural transition becomes meaningful when price begins establishing higher levels after the repeated support defense.
Head and Shoulders Pattern
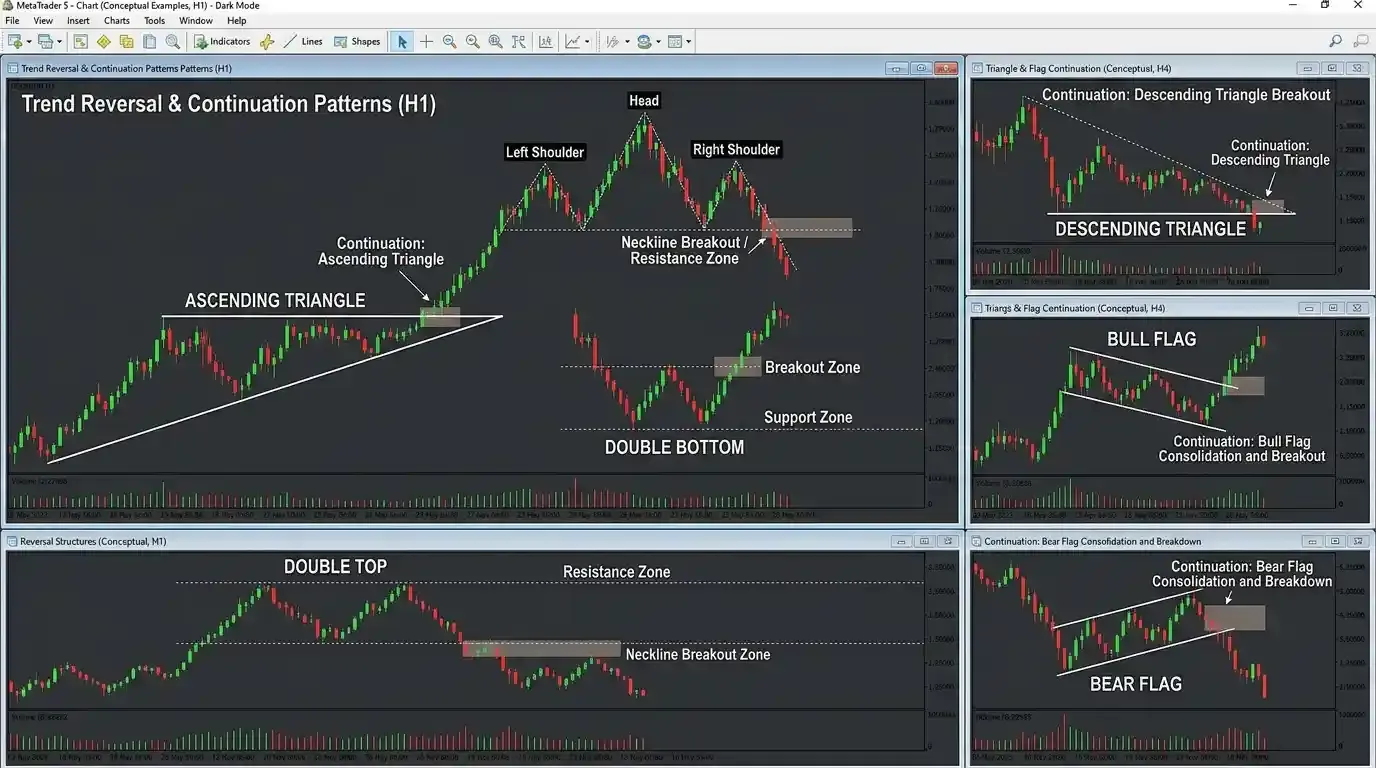
The head and shoulders pattern is a well-known bearish reversal structure. It generally contains three major peaks: a left shoulder, a higher central peak called the head and a right shoulder that fails to reach the height of the head. Reaction lows between these peaks help define a neckline.
The underlying logic involves weakening bullish structure. Price first forms a high, then produces an even higher high, but the final rally cannot repeat the same strength. When the neckline breaks, the market has also broken important support.
Suppose an index forms a first high around 5,000, reaches 5,100 on the next major advance and then produces a final rally that fails near 5,040. If support connecting the intervening lows breaks afterward, the sequence may indicate that the earlier uptrend has lost structural control.
The Neckline Matters More Than Visual Perfection
Traders sometimes focus excessively on whether a head-and-shoulders pattern looks aesthetically perfect. In practice, the neckline and underlying price structure are more important than symmetry.
A right shoulder slightly higher or lower than the left can still represent weakening trend behavior if the broader sequence remains valid. A sloping neckline can also occur.
The key questions are whether the head represents a meaningful final higher high, whether the right shoulder shows failure to continue that structure and whether support subsequently breaks.
A pattern that looks visually perfect but lacks a meaningful trend beforehand may be less useful than an imperfect-looking structure that clearly reflects a real transition in market behavior.
Reversal Patterns Need a Trend to Reverse
A reversal pattern should normally be evaluated relative to what happened before it. A double top after a strong uptrend has logical reversal context. Two similar highs inside a random sideways range may simply be the upper boundary of that range.
Likewise, a double bottom after a prolonged decline can represent repeated rejection of lower prices. Two lows inside an established range do not necessarily indicate a new bullish trend.
This principle prevents traders from classifying ordinary consolidation as a major reversal structure.
If no meaningful prior trend exists, there may be little to reverse.
Chart Patterns and Market Structure
The broad concept of market structure helps connect all chart patterns. Ascending triangles involve rising lows under resistance. Descending triangles involve falling highs over support. Double tops involve repeated highs followed by potential support failure. Double bottoms involve repeated lows followed by potential resistance failure. Head-and-shoulders patterns represent a transition from stronger highs to a weaker final rally.
The dedicated market structure trading framework can help traders understand these sequences without becoming dependent on pattern names.
This matters because real charts frequently produce structures that resemble multiple named patterns at once. Market structure gives traders a simpler language: higher highs, lower highs, support, resistance, breakout and failure.
Pattern Confirmation
Pattern confirmation usually involves price doing something that supports the expected interpretation. For a triangle, confirmation may involve a breakout beyond its boundary. For a double top, it may involve breaking the reaction low between the peaks. For a head-and-shoulders structure, traders commonly watch the neckline.
Confirmation reduces the risk of entering before the market has actually changed, but it creates a trade-off. Waiting for confirmation often means entering farther from the most favorable price.
For example, a trader attempting to anticipate a double bottom near support may obtain an excellent price if the reversal succeeds. A trader waiting for the neckline break enters later but has more evidence that market structure has changed.
Neither approach eliminates risk. They simply distribute uncertainty differently.
Pattern Invalidation
Every chart pattern should have a point where its interpretation no longer makes sense. Without invalidation, the trader can continue redefining the pattern indefinitely whenever price moves against the expected direction.
Suppose an ascending triangle is expected to break upward. If price instead breaks below the rising sequence of lows, the bullish structure has deteriorated. Calling the new decline "a larger triangle" merely to preserve the original trade can become confirmation bias.
A valid trading plan accepts that patterns fail.
Defining invalidation beforehand keeps pattern recognition objective and makes position sizing possible.
False Breakouts
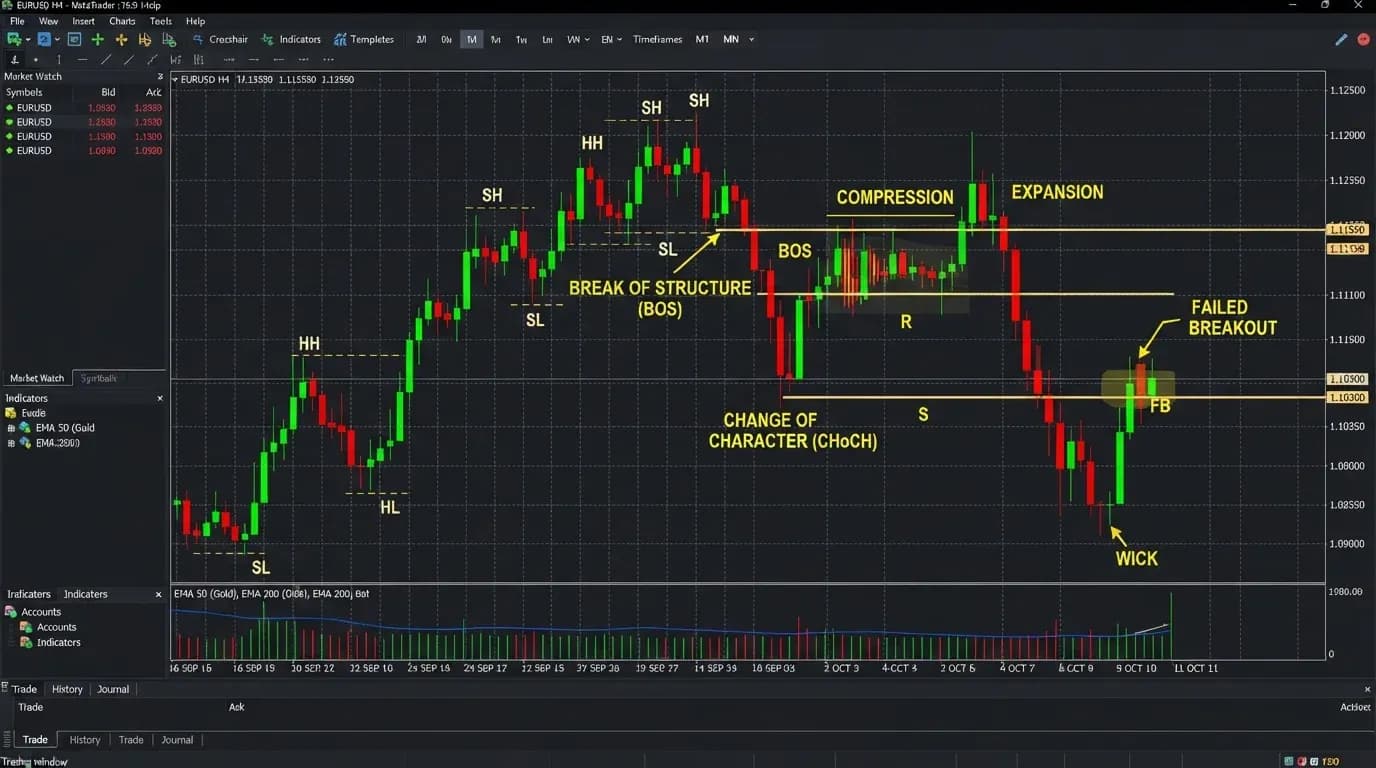
A false breakout occurs when price moves beyond a chart-pattern boundary but fails to sustain the move. These events are common because obvious levels attract stop orders, breakout entries and liquidity.
Suppose EUR/USD breaks above triangle resistance at 1.1100 and reaches 1.1125. Buyers enter the breakout. Price then reverses sharply, closes below 1.1100 and later breaks the opposite side of the triangle.
The initial bullish breakout has failed.
This type of behavior connects directly with failed breakout trading. A failed breakout can sometimes become more informative than the original pattern because it reveals that the market could not maintain prices beyond an obvious boundary.
False Breakout vs Liquidity Sweep
The distinction between a false breakout vs liquidity sweep can become relevant when price briefly exceeds obvious highs or lows before reversing. From a practical chart perspective, the important observation is that the market traded beyond a recognized level but failed to maintain acceptance there.
Traders should be cautious about claiming to know the exact institutional intention behind every wick. A move beyond a high can trigger stops and attract breakout orders, but the chart itself primarily shows the price event and subsequent rejection.
The more defensible analysis focuses on whether the breakout held, where price closed and how market structure developed afterward.
Pattern Retests
After a breakout, price often returns toward the broken boundary. This is commonly called a retest.
Suppose an ascending triangle breaks above resistance at 1.1100 and reaches 1.1150. EUR/USD later returns toward 1.1100. If buyers defend the old resistance and price begins rising again, the retest supports the interpretation that the breakout level has become support.
If price falls straight through 1.1100 and returns inside the triangle, the breakout becomes less convincing.
A retest is not mandatory. Some markets break and continue without returning. Waiting for a retest may improve entry location in some cases but can also mean missing the trade completely.
Chart Patterns and Volume
Participation can add useful context to chart patterns. During many consolidations, activity can decrease as price compresses. When a breakout eventually occurs, expanding activity can suggest greater participation behind the move.
For example, suppose an ascending triangle develops while volume gradually declines. Price then breaks above resistance while volume increases substantially. The combination can support the breakout case.
The interpretation should remain conditional. High-volume breakouts can still fail, and low-volume breakouts can occasionally continue. Volume strengthens or weakens the evidence rather than determining the result.
Chart Patterns and Volatility
Chart patterns often involve changes in volatility. Triangles commonly contract as their boundaries narrow. Flags can represent temporary lower-volatility pauses after impulsive movement. Breakouts can coincide with volatility expansion.
The volatility indicators traders use can help quantify these changes. Declining ATR or narrowing volatility bands may accompany pattern compression, while a breakout can cause ranges to increase.
This connection is particularly important for stop placement. A stop that looks reasonable during compression may become extremely tight once volatility expands. Traders should therefore evaluate the expected post-breakout environment rather than sizing every trade according to the quietest part of the pattern.
Chart Patterns and Moving Average Support or Resistance
A chart pattern may become more interesting when one of its structural areas coincides with a moving average, though the average should not be treated as a physical barrier. The concept of moving average support resistance can provide additional trend context when price repeatedly reacts around an average.
Suppose a bull flag develops during an uptrend and its lower boundary also sits close to a rising 50 EMA. If buyers repeatedly defend that region, several observations point toward the same area.
The pattern, the trend and the moving-average relationship can support one another, but all are still derived largely from price. Traders should avoid treating this as three guaranteed independent signals.
Chart Patterns and Price Action
The next broader layer beyond named formations is the price action trading guide, where traders study price behavior without needing every structure to fit a specific pattern label.
This is useful because many real markets create incomplete or hybrid formations. A consolidation might begin as a triangle, evolve into a range and eventually break through a level that was not obvious when the structure first developed.
Price action analysis allows traders to adapt to these changes by following the actual sequence of highs, lows, breakouts and failures.
Named patterns are useful shorthand, but price behavior remains the underlying information.
Logarithmic vs Linear Charts
The difference between a logarithmic vs linear chart can affect how longer-term chart patterns appear, especially when an instrument has experienced large percentage changes.
A linear chart gives equal vertical distance to equal absolute price changes. A move from 10 to 20 occupies the same vertical distance as a move from 100 to 110 if both are ten units.
A logarithmic chart emphasizes percentage changes. Moving from 10 to 20 represents a 100% increase, while moving from 100 to 110 represents only 10%.
For shorter-term forex analysis, the difference may be small. For long-term assets that have appreciated substantially, chart scaling can materially affect trendlines and the apparent geometry of large patterns.
Chart Pattern Targets
Traders often use pattern dimensions to estimate possible targets. For example, the height of a triangle may be projected from the breakout point, while a double-top target may be estimated from the distance between resistance and the neckline.
These calculations can provide a structured reference, but they should not be treated as promises.
Suppose a triangle is 100 points high and breaks upward. A textbook projection may suggest another 100 points. The market could travel 40 points and reverse, move 200 points, or never sustain the breakout at all.
Pattern targets are analytical estimates, not guaranteed destinations. Existing support, resistance and volatility should also be considered.
Reward-to-Risk Matters More Than Pattern Beauty
A chart pattern can look perfect and still produce an unattractive trade.
Suppose a bull flag breaks upward, but the only logical invalidation point is 100 pips below the entry while the next major resistance is only 50 pips higher. Even if the pattern is technically convincing, the available reward relative to risk may be poor.
Another setup might look less visually perfect but offer a logical 30-pip invalidation with 90 pips of available room before major resistance.
Chart patterns trading should therefore evaluate both probability and payoff structure.
The pattern helps define the scenario. Risk management determines whether acting on that scenario is financially sensible.
Position Size and Pattern Width
Pattern width can influence the distance to invalidation. A wide triangle or large head-and-shoulders structure may require a wider stop than a smaller formation.
If a trader wants to maintain consistent monetary risk, position size should adapt accordingly.
Suppose a trader allows $100 of risk. Pattern A requires a 20-pip stop, while Pattern B requires an 80-pip stop. Using the same position size would make Pattern B approximately four times more risky in pip terms, assuming equal pip value.
The correct response is not necessarily to place an artificially tight stop inside the wider pattern. Position size can instead be reduced so the technical invalidation and financial risk remain compatible.
Chart Patterns and Trading Orders
Once a pattern creates a potential setup, the trader still needs an execution method. A breakout trader might use a market order after confirmation or use an appropriate pending order depending on the strategy. Someone waiting for a retest might prefer a limit order near the broken level.
The order type should match the scenario rather than being chosen automatically.
A market order prioritizes participation after the breakout but can involve slippage during fast movement. A limit order can improve price control but may never execute if the market does not return.
The chart pattern identifies the market condition. Execution determines how the trader attempts to participate.
Chart Patterns on MetaTrader 5
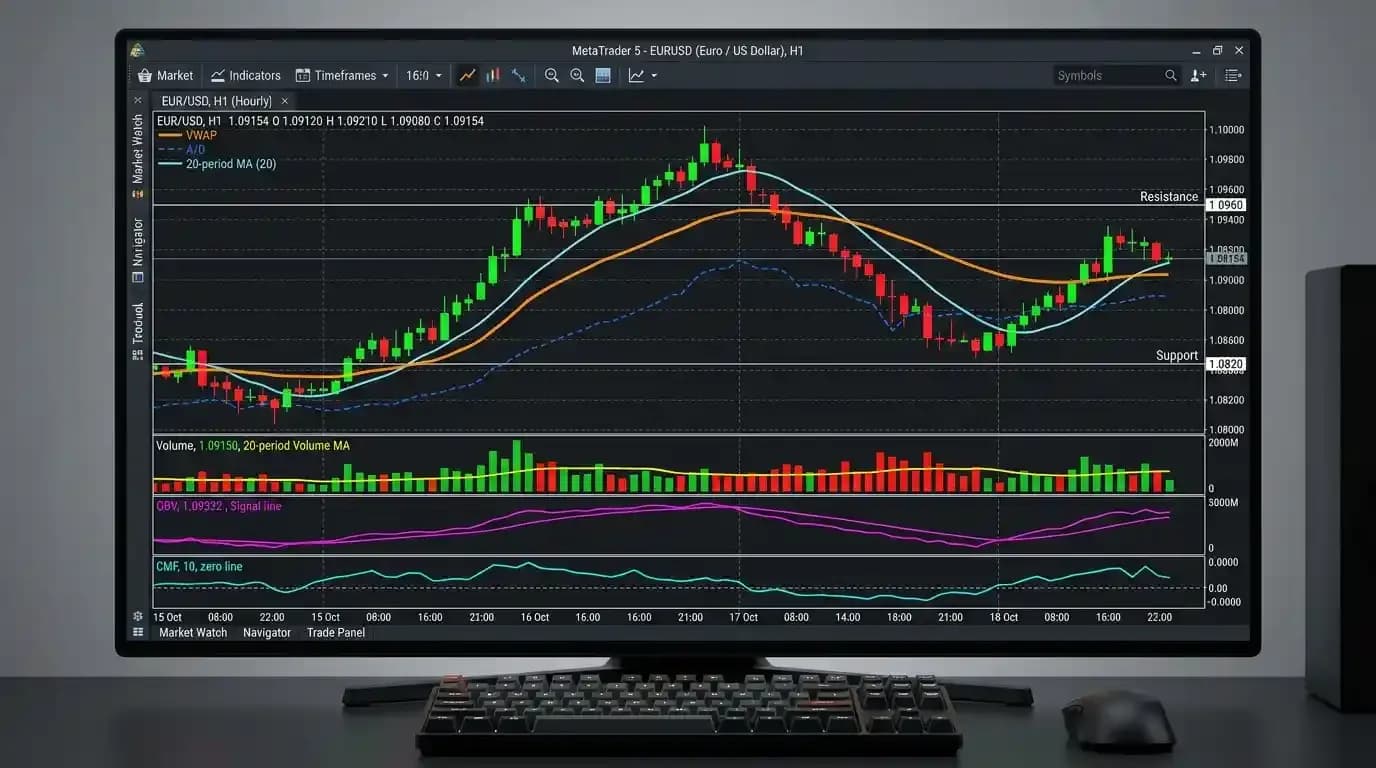
Traders can analyze supported instruments through the MetaTrader 5 platform, where trendlines and horizontal levels can be used to mark pattern boundaries. The platform makes it straightforward to compare structures across multiple timeframes, but drawing tools do not remove subjectivity.
Two traders can look at the same chart and draw slightly different triangle boundaries because one emphasizes candle closes while another includes extreme wicks. Neither drawing is automatically correct.
Consistency matters more than forcing mathematical perfection. A trader should use a repeatable method and pay attention to the broader price region rather than adjusting lines repeatedly until the desired pattern appears.
Chart Patterns in Forex Trading
Chart patterns trading is widely applied to forex trading because currency pairs frequently move through trends, consolidations and breakouts. EUR/USD might form an ascending triangle before an important resistance level, while GBP/USD could develop a bear flag during a larger decline.
Forex traders should remember that scheduled economic events can invalidate technical structures rapidly. A triangle that has developed for several sessions may break sharply when inflation data or a central-bank decision changes market expectations.
This does not make chart patterns useless. It means that technical structure exists within a market influenced by new information.
Chart Patterns in Gold
Gold frequently forms recognizable consolidation and reversal structures, particularly after strong macroeconomic moves. A bull flag can develop after a rapid advance, or a double top can form around an important resistance region.
Gold's volatility means pattern boundaries should often be interpreted as zones rather than single exact prices. Wicks can extend beyond visually obvious trendlines before price returns inside the structure.
Traders should also consider that gold can respond sharply to interest-rate expectations, currency movements and geopolitical developments. A technically clean pattern can change rapidly when new information arrives.
Chart Patterns in Indices
Index charts can produce flags, triangles, double tops and other recognizable structures across intraday and higher timeframes. Market openings can generate particularly strong breakout movement, which makes execution and volatility relevant.
For traders in Pakistan, active US index conditions generally occur later in the local day. A triangle developing before a major US session can behave very differently after the underlying market becomes fully active.
Session timing therefore matters. A pattern that looks stable during a quieter period can expand rapidly when liquidity and participation change.
Chart Patterns in Cryptocurrency Markets
Chart patterns can also appear in supported cryptocurrency instruments. Triangles, flags and double tops are created by the same broad interaction of buyers and sellers.
However, crypto markets can experience large wicks and rapid volatility changes. A breakout can travel significantly beyond a level and reverse within a short period, creating false signals that look dramatic on the chart.
Traders should therefore allow the instrument's normal volatility to influence how precisely pattern boundaries are interpreted and how much financial exposure is attached to the setup.
Multi-Timeframe Chart Pattern Analysis
A pattern should be interpreted within the timeframe on which it forms. A triangle on a five-minute chart represents short-term market behavior, while a daily triangle can develop over weeks.
Multiple timeframes can help place a pattern in broader context. Suppose a one-hour bull flag forms while the daily market is in a clear uptrend. The two structures align. If the same one-hour bull flag develops directly beneath major daily resistance in a long-term downtrend, the setup becomes more complicated.
Higher-timeframe context does not guarantee the lower-timeframe result, but it prevents short-term formations from being interpreted without reference to larger market structure.
Chart Patterns and Pakistan Standard Time
Chart patterns themselves do not change for traders in Pakistan, but session timing can influence when formations break or become active. European forex activity develops during Pakistan's daytime, while US market activity generally becomes stronger later in the local day.
A trader in Pakistan might see a narrow EUR/USD triangle form during a quiet period and then experience the actual breakout as London or New York participation increases.
Platform server time can also affect candle boundaries, which means a pattern drawn from four-hour candles may appear slightly different across platforms. Traders should understand the chart settings before assuming that only one version of the structure is valid.
Chart Patterns for Traders in Khyber Pakhtunkhwa
A trader in Peshawar, Mardan, Abbottabad, Swat, Nowshera, Kohat, Bannu, Mansehra, Haripur or another part of Khyber Pakhtunkhwa can use the same chart patterns trading principles as a trader elsewhere. The underlying EUR/USD, gold or global-index structure is not changed by the trader's location.
The practical consideration is timing and monitoring. A trader who can review charts only periodically may prefer four-hour or daily structures, which generally develop more slowly. Someone actively following European forex markets during Pakistan's daytime may use shorter timeframes. Traders focused on US markets may find their most active period later in the day.
The analytical method should fit the trader's actual schedule rather than requiring constant monitoring that is unrealistic.
Connectivity and Pattern Breakouts
Pattern breakouts can develop quickly, particularly when volatility expands after a long period of compression. If a trader relies entirely on manual execution, inconsistent connectivity can make short-term breakout strategies more difficult to manage.
A triangle might spend hours forming and then complete its breakout within minutes. A fast-moving gold or index market can travel significantly before connectivity is restored.
This practical risk does not invalidate chart patterns trading, but it should influence timeframe selection, position management and the type of execution strategy used.
Common Chart Pattern Mistakes
One of the most common mistakes is forcing a pattern onto price because the trader wants a particular outcome. Trendlines are repeatedly adjusted until a triangle appears, two vaguely similar highs are labeled a double top, or every short consolidation after a rally becomes a bull flag. Another frequent mistake is entering before the pattern has actually confirmed, while some traders wait so long that the market has already moved far beyond a sensible entry. Pattern targets are also often treated as guaranteed destinations rather than estimates.
The solution is to keep the analysis grounded in structure. Identify meaningful highs, lows, support and resistance first. Then decide whether a recognizable pattern genuinely summarizes that behavior.
Drawing Trendlines to Fit a Pattern
A trader may begin with the belief that EUR/USD is forming an ascending triangle. The lower boundary does not quite fit, so the line is moved. A later low breaks the line, so the boundary is moved again. Eventually almost any collection of candles can be turned into the desired pattern.
This destroys the analytical value of the structure.
Trendlines should summarize meaningful price reactions rather than be manipulated to preserve a trade thesis. If the market no longer respects the original structure, that information should be accepted.
A failed pattern is still useful because it tells traders that market behavior changed.
Entering Before Confirmation
Anticipating a breakout can provide a better entry if the trader is correct, but it also exposes the trader before the market has demonstrated which direction will win.
Suppose an ascending triangle is pressing beneath resistance. Buying before the breakout assumes that resistance will fail. If sellers defend the level again and price breaks the lower boundary instead, the trader entered based on expectation rather than confirmation.
This does not make anticipatory entries inherently wrong. It means they involve a different risk profile and should be part of a deliberate strategy rather than an impulsive attempt to enter early.
Entering Too Late
Waiting for excessive confirmation creates the opposite problem. A bull flag breaks upward, price travels a substantial distance, several candles close higher and the trader finally enters because the move now looks certain.
By that point, the logical stop may be far away and nearby resistance may reduce the available upside.
The trader has exchanged uncertainty for poor entry location.
Chart patterns trading requires balancing confirmation with reward-to-risk rather than trying to eliminate uncertainty completely.
Treating Every Pattern Target as Guaranteed
Pattern projections can create false precision. A trader measures a 200-point triangle and assumes the breakout must travel exactly 200 points.
Markets do not know the projection.
Existing support, resistance, volatility, economic events and changing participation can all interrupt the move before the estimated objective.
Targets are planning tools.
If market structure changes before the projected level is reached, the trader should evaluate the new information rather than holding solely because a textbook diagram contained a target formula.
Ignoring Failed Patterns
A failed pattern can contain valuable information. Suppose a well-defined double top breaks above resistance rather than confirming lower. Traders positioned for the bearish reversal may need to exit, while the failed reversal itself can create evidence of stronger buying pressure.
Similarly, a bull flag that breaks downward may indicate that the previous uptrend is weaker than expected.
Instead of treating pattern failure as analytical embarrassment, traders can view it as new market information.
The goal is not to prove the original interpretation correct. The goal is to respond to what price actually does.
Chart Pattern Risk Management
No chart pattern is reliable enough to remove the need for risk control. A perfectly shaped head-and-shoulders pattern can fail after the neckline breaks. A triangle can produce a false breakout. A bull flag can reverse into a larger decline.
Before entering, the trader should know what price would invalidate the setup and how much money would be lost if that invalidation occurs. Position size can then be adjusted to keep financial exposure within the intended limit.
The attractiveness of the pattern should never determine leverage. A setup that looks unusually convincing can fail just as any other market scenario can.
A Practical Ascending Triangle Example
Suppose EUR/USD has resistance around 1.1100. The first reaction low occurs at 1.1000, the next at 1.1040 and the third at 1.1070. Price is repeatedly testing 1.1100 while pullbacks become progressively shallower.
The structure resembles an ascending triangle.
EUR/USD eventually closes above 1.1100 at 1.1120. Instead of accelerating immediately, it pulls back toward 1.1100 and stabilizes. Buyers then return and price begins rising again.
The trader now has several pieces of information: rising lows, repeated resistance pressure, a breakout and a successful retest.
The setup remains uncertain. If EUR/USD falls decisively back below the pattern, the bullish interpretation weakens.
A Practical Double Top Example
Suppose GBP/USD has been trending upward and reaches 1.3000 before falling to 1.2850. Price later recovers toward 1.3010 but again fails to continue higher. The second rejection produces a bearish reaction.
The structure now contains two major highs around the same resistance area and an intervening low at 1.2850.
Rather than shorting simply because the second high exists, a trader waits to see whether GBP/USD breaks below 1.2850. If it does, the market has broken the structural support separating the peaks.
If GBP/USD instead breaks above 1.3010 and maintains the move, the double-top thesis has failed.
A Practical Bull Flag Example
Suppose gold rises sharply from 2,450 to 2,520. Instead of immediately reversing, price begins a controlled pullback and trades between 2,495 and 2,515 for several periods. The broader structure remains bullish and major support has not failed.
Gold eventually closes above the upper flag boundary near 2,515 and begins expanding higher.
The pattern can be interpreted as continuation because the initial bullish impulse was followed by relatively controlled consolidation and then renewed upward movement.
If gold had broken below the flag and important structural support, the same formation would no longer support the bullish scenario.
A Practical Head-and-Shoulders Example
Suppose an index has been trending upward. It reaches 5,000, falls toward 4,900 and then rallies to 5,120. After another decline toward 4,900, the market rallies again but reaches only 5,030 before weakening.
The first peak can be viewed as the left shoulder, 5,120 as the head and the weaker final rally as the right shoulder. The reaction lows around 4,900 form the important neckline region.
If the index breaks below 4,900 and remains there, the bearish reversal interpretation becomes stronger.
If the index instead breaks above 5,120, the pattern has failed and the earlier uptrend may still be intact.
Building a Practical Chart Pattern Routine
A useful chart patterns trading routine begins with broad market structure. Determine whether price is trending, ranging or transitioning between the two. Mark only meaningful support and resistance areas. Then identify whether the sequence of highs and lows naturally forms a recognizable continuation or reversal structure. Observe current volatility and participation, and consider whether the pattern aligns with the higher timeframe. Define the boundary that would confirm the scenario and the level that would invalidate it. Only after those questions are answered should entry method, stop distance and position size be considered.
This process keeps pattern recognition grounded in actual market behavior rather than turning technical analysis into a search for geometric shapes.
Chart Patterns Trading FAQs
What are chart patterns in trading?
Chart patterns are recognizable multi-candle price structures that traders use to interpret trends, consolidations, breakouts and possible reversals.
What are continuation patterns?
Continuation patterns develop during an existing trend and may indicate that the trend could resume after a temporary pause or consolidation.
What are reversal patterns?
Reversal patterns can indicate that the balance between buyers and sellers is changing and that an existing trend may be weakening or reversing.
What is an ascending triangle?
An ascending triangle generally contains horizontal resistance and progressively higher lows.
What is a descending triangle?
A descending triangle usually contains horizontal support and progressively lower highs.
Is an ascending triangle always bullish?
No. It often receives a bullish interpretation, but the pattern can fail or break downward.
Is a descending triangle always bearish?
No. A downside breakout may be expected, but buyers can regain control and invalidate the structure.
What is a bull flag?
A bull flag is a continuation structure that generally forms after a strong upward move followed by a controlled consolidation.
What is a bear flag?
A bear flag commonly develops after a strong decline followed by a temporary upward or sideways correction.
What is a double top?
A double top is a potential bearish reversal structure involving two major highs near a similar resistance region with a reaction low between them.
What confirms a double top?
Traders commonly watch for a break below the reaction low or neckline between the two peaks.
What is a double bottom?
A double bottom is a potential bullish reversal structure involving two lows around a similar support region with a recovery high between them.
What is a head-and-shoulders pattern?
It is a potential bearish reversal formation containing a left shoulder, higher central head, lower right shoulder and an important neckline.
Do chart patterns have to be perfectly symmetrical?
No. Real markets rarely create mathematically perfect formations. The underlying price structure matters more than visual perfection.
What is a chart pattern breakout?
A breakout occurs when price moves beyond an important boundary of the pattern.
Can chart pattern breakouts fail?
Yes. False breakouts are common and can occur even after apparently strong confirmation.
Should I wait for a candle close before trading a breakout?
Some strategies use candle-close confirmation while others enter earlier. Waiting can provide more evidence but may produce a later entry.
Are pattern retests necessary?
No. Some breakouts retest their boundaries, while others continue without returning.
Can volume confirm a chart pattern?
Increasing participation can support a breakout interpretation, but volume cannot guarantee continuation.
Does volatility matter with chart patterns?
Yes. Volatility influences pattern width, breakout behavior, stop distance and the likelihood of large price swings around boundaries.
Are chart patterns useful for forex?
Yes. Traders commonly use triangles, flags, double tops, double bottoms and other structures in forex markets.
Do chart patterns work for gold?
They can be applied to gold, although gold's volatility can cause substantial overshoots and false breakouts.
Can chart patterns be used for indices?
Yes. Index charts frequently develop continuation, consolidation and reversal structures.
Can chart patterns be used for cryptocurrency markets?
Yes, but crypto volatility can produce rapid breakouts, long wicks and failed patterns.
Which timeframe is best for chart patterns?
There is no universal best timeframe. Higher timeframes show broader structures, while lower timeframes provide more detailed but noisier setups.
Can the same market show different patterns on different timeframes?
Yes. A daily uptrend can contain an hourly bear flag or other short-term countertrend structure.
Do chart patterns work differently in Pakistan?
No. The structures themselves are global. Traders in Pakistan mainly need to account for international session timing and platform chart settings.
Are chart patterns different for traders in KPK?
No. Traders in Peshawar, Mardan, Abbottabad, Swat and elsewhere in KPK can use the same price-structure principles. Local schedule and connectivity affect practical execution rather than pattern mechanics.
Can chart patterns predict exact targets?
Pattern projections can provide estimates, but markets are not required to reach those targets.
What invalidates a chart pattern?
Invalidation depends on the structure. It generally occurs when price behaves in a way that contradicts the original pattern thesis, such as breaking the opposite boundary or important structural level.
Can chart patterns guarantee profitable trades?
No. Continuation and reversal patterns can fail, false breakouts are common, and leveraged trading can amplify losses when the market moves against the position.
Disclaimer: Chart patterns such as triangles, flags, double tops, double bottoms and head-and-shoulders formations describe historical and current price structure; they do not guarantee a breakout, continuation, reversal or projected target. Patterns can fail, apparent breakouts can reverse, and changing volatility or unexpected events can invalidate technically sound setups quickly. Leveraged positions can magnify losses when a market moves against the trade. This material is provided for general education and is not personalized investment, trading, financial, legal or tax advice. Medatiq's supported instruments, spreads, execution conditions, margin requirements and platform functionality may vary or change.
Trade forex, gold, and indices with Medatiq Markets
Enjoy tight spreads and fast execution, built for market condition.