Technical Analysis for Trading: Complete Beginner Guide
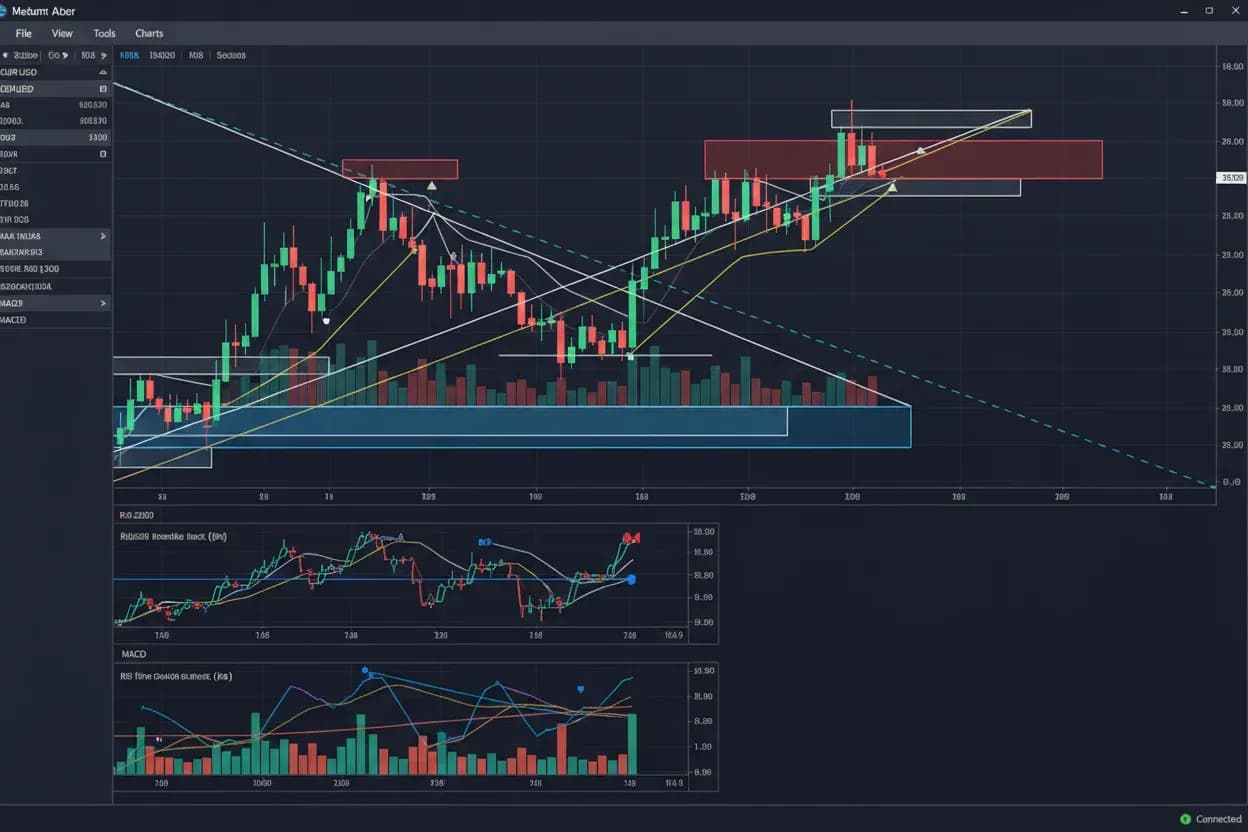
Technical analysis for trading is the study of price behavior to understand trend, momentum, volatility, market structure and potential areas where buying or selling pressure may change. Instead of starting with company earnings, economic growth or interest-rate policy, technical analysis begins with what price is actually doing on the chart. Traders examine previous highs and lows, support and resistance, candlestick behavior, trend direction and mathematical indicators to organize that information. The aim is not to predict every market move correctly. It is to develop a structured way to interpret current conditions, define possible scenarios and decide where a trade idea would no longer make sense. Technical analysis can be applied to forex, gold, indices and other actively traded markets, but no chart pattern or indicator guarantees a profitable outcome. A useful approach combines price context, suitable timeframes, disciplined execution and risk management rather than relying on a single signal.
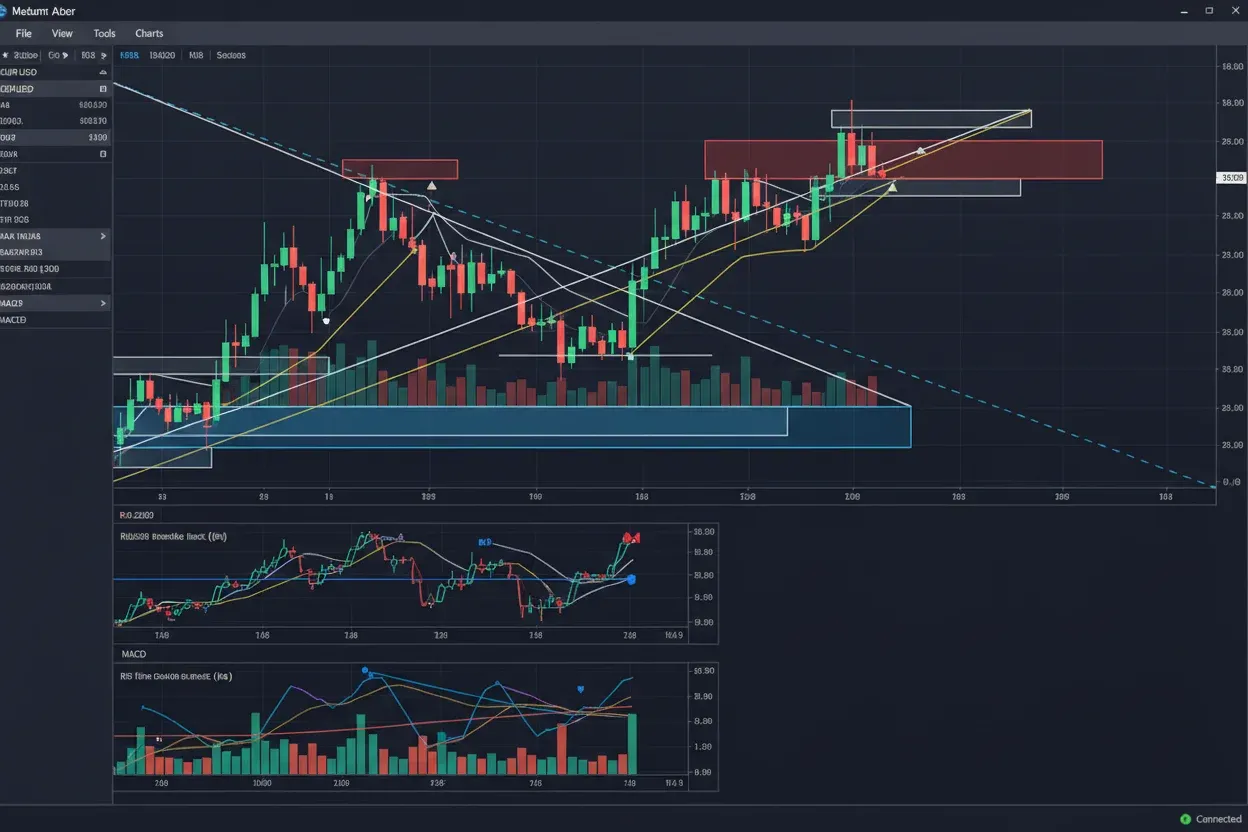
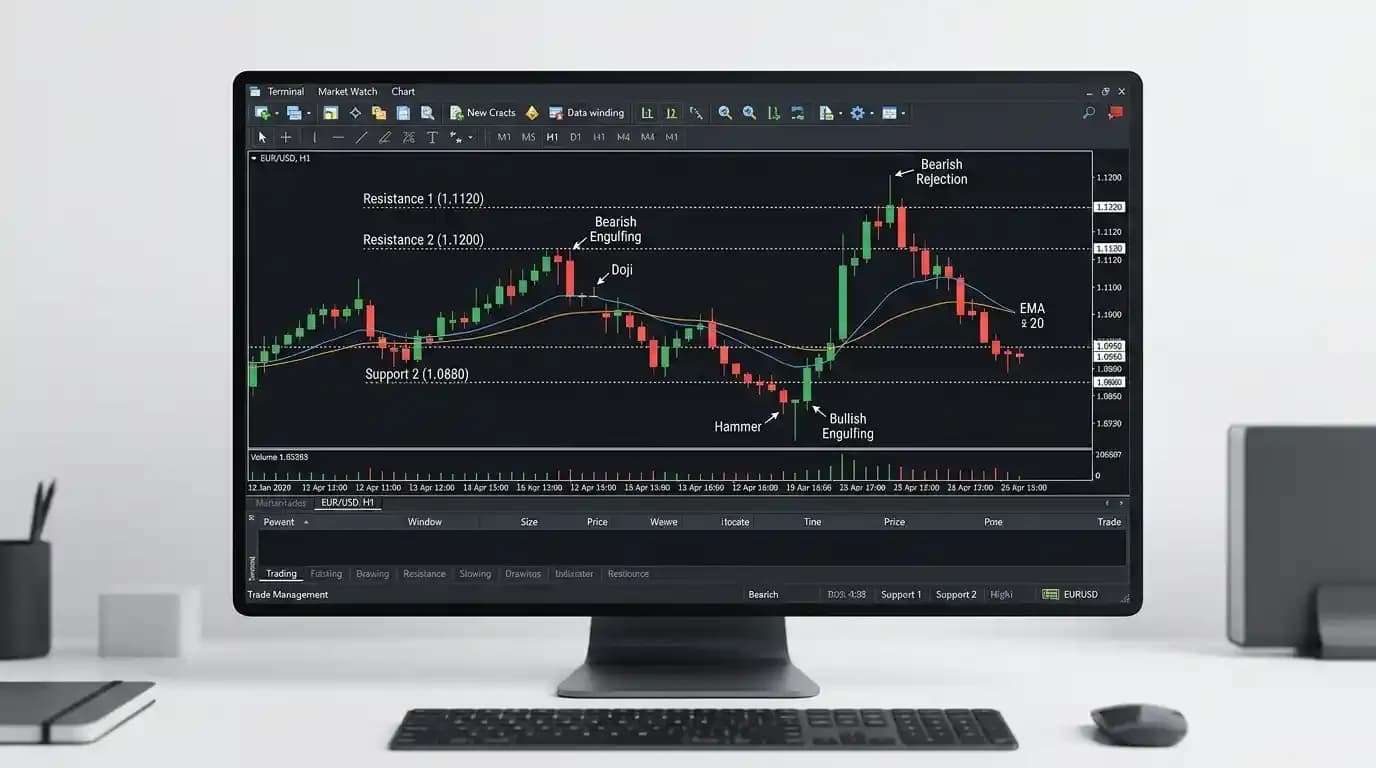
Traders using MetaTrader 5 can view price charts, change timeframes and apply technical indicators to supported markets available through Medatiq.
What Is Technical Analysis for Trading?
Technical analysis for trading examines historical and current market-price information to help traders assess what the market is doing.
A chart can reveal whether price is generally rising, falling or moving sideways. It can also show whether previous highs or lows are being respected, whether volatility is increasing and whether momentum appears to be strengthening or weakening.
Technical analysis normally focuses on information such as:
- Price
- Time
- Market structure
- Trend
- Volatility
- Momentum
- Volume or participation data where available
The process is based on observable market behavior rather than certainty about what will happen next.
A trader may identify an uptrend and still experience a losing long trade. A support level may break. A momentum indicator may reverse. A chart pattern may fail.
Technical analysis provides a framework for decision-making, not a guarantee.
How Technical Analysis Works
Technical analysis starts with a simple idea: market prices continuously reflect the interaction between buyers and sellers.
When buying pressure exceeds selling pressure, price can rise.
When selling pressure becomes stronger, price can fall.
When neither side maintains control, the market may trade sideways.
Charts record those changes over time. Traders then look for recurring structures and measurable characteristics that can help describe the current market environment.
For example, a market making progressively higher highs and higher lows may be interpreted as trending upward.
A market repeatedly rejecting the same upper area may be encountering resistance.
A market moving within a narrow range may be consolidating.
The trader then decides whether those conditions fit the type of setup being considered.
Price Comes First
Indicators can be useful, but every technical indicator is ultimately derived from market data.
Price therefore remains the foundation of technical analysis.
Imagine EUR/USD has risen from 1.0800 to 1.1000, pulled back to 1.0940 and then rallied to 1.1050.
Even before applying an indicator, the chart already contains useful information.
The market has produced a higher high.
The pullback remained above the earlier starting area.
Price then pushed to another new high.
A trader may describe this as constructive upward structure.
That does not guarantee the next move will be higher, but it provides a clearer context than looking at one isolated candle.
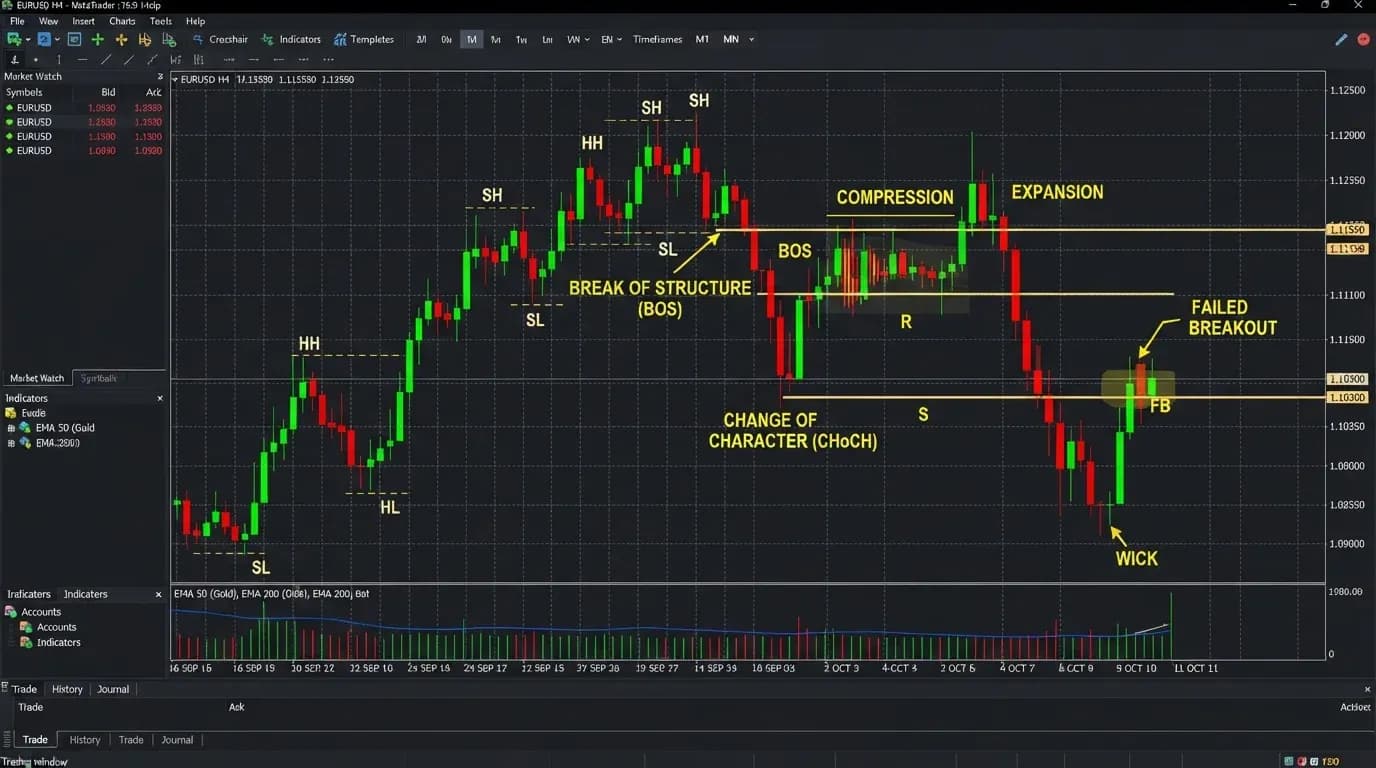
Understanding Market Structure
Market structure describes the way price forms highs and lows.
An upward structure commonly contains:
Higher highs
Higher lows
A downward structure commonly contains:
Lower highs
Lower lows
A sideways market tends to fluctuate between broader upper and lower boundaries without maintaining either sequence.
Consider a simplified upward progression:
Low: 1.0800
High: 1.0900
Higher low: 1.0850
Higher high: 1.0950
Higher low: 1.0900
Higher high: 1.1000
The pattern suggests that buyers have repeatedly been willing to support price at progressively higher levels.
Technical traders may use this information before introducing indicators.
Trends in Technical Analysis
A trend represents sustained movement in a broad direction.
There are three basic market states:
Uptrend: price generally progresses higher.
Downtrend: price generally progresses lower.
Range or sideways market: neither direction maintains control.
Trend identification matters because many technical tools behave differently depending on the environment.
A moving-average crossover may be more useful during a sustained trend than during a narrow sideways market.
An oscillator may provide frequent overbought and oversold readings during a range but remain elevated or depressed for long periods during a strong trend.
The trend indicators used by traders can help organize directional information, but they should still be interpreted within the underlying price structure.
Support and Resistance
Support and resistance are among the most widely used concepts in technical analysis.
Support is an area where declining price has previously attracted enough buying interest to slow, stop or reverse the move.
Resistance is an area where rising price has previously encountered sufficient selling pressure to slow or reverse.
Suppose EUR/USD repeatedly falls toward:
1.0900
and then rebounds.
Traders may begin treating the area around 1.0900 as support.
If EUR/USD repeatedly rises toward:
1.1050
and then falls, the region may act as resistance.
These areas are better understood as zones rather than exact mathematical barriers.
Price may move slightly through a previous level before reversing.
It may also break through completely.
Why Support and Resistance Can Matter
Markets involve many participants watching similar price history.
Previous highs, lows, breakout areas and consolidation zones can therefore influence current decision-making.
A trader who previously bought near 1.0900 may consider buying there again.
Someone who missed the previous move might also wait for the same area.
Other traders may place stop orders around the level.
When many decisions become concentrated around a price region, market behavior can change.
However, the fact that a level worked before does not guarantee that it will work again.
Every additional test can occur under different liquidity, volatility and economic conditions.
Candlestick Charts
Candlestick charts show the open, high, low and close for a selected period.
A single candle can tell traders where price started, how far it moved in both directions and where it finished.
For example, a bullish candle may show that price closed above its opening level.
A bearish candle closes below its opening level.
The upper and lower shadows indicate prices reached during the period but not maintained through the close.
Candlesticks become more useful when viewed in context.
A large bullish candle appearing randomly in the middle of a range may mean little.
The same candle appearing after a failed breakdown at major support can have a different interpretation.
Timeframes in Technical Analysis
Every chart timeframe summarizes price differently.
A five-minute candle represents five minutes of activity.
A one-hour candle represents one hour.
A daily candle covers a full trading day according to the platform's chart construction.
Understanding trading chart timeframes is important because the same market can appear bullish on one timeframe and bearish on another.
EUR/USD may be trending upward on a daily chart while falling on a 15-minute chart during a temporary pullback.
Neither view is necessarily wrong.
They describe different parts of the same market movement.
Higher and Lower Timeframes
Higher timeframes generally provide broader market context.
Lower timeframes reveal more short-term detail.
A trader might use a four-hour chart to determine overall trend direction and a 15-minute chart to examine a possible entry.
Another trader holding positions for several days may prefer daily and four-hour charts.
A short-term trader might focus on one-hour, 15-minute and five-minute periods.
The timeframe should match the decision being made.
Using a one-minute chart to determine a multiweek trend can produce unnecessary noise. Using a weekly chart to manage a five-minute trade may provide too little detail.
Moving Averages
Moving averages in trading smooth price data to make directional movement easier to see.
A simple moving average calculates the average closing price over a specified number of periods.
For a five-period simple moving average:
SMA = (P1 + P2 + P3 + P4 + P5) ÷ 5
where each P represents a closing price.
If the five closes are:
100
102
101
103
104
then:
SMA = (100 + 102 + 101 + 103 + 104) ÷ 5
SMA = 510 ÷ 5
SMA = 102
As each new period closes, the oldest value drops out and the newest one is added.
Simple vs Exponential Moving Average
A simple moving average gives equal weight to each value within its calculation period.
An exponential moving average places greater weight on more recent price data.
The exponential moving average indicator therefore tends to respond more quickly to recent price changes than a comparable simple moving average.
Neither method is universally superior.
A faster response can identify changing conditions earlier, but it can also create more short-term fluctuations and false signals.
The appropriate choice depends on the market, timeframe and trading method.
Moving Average Signals
Traders use moving averages in several ways.
Price trading above a rising moving average may support an upward-trend interpretation.
Price below a declining average may support a downward view.
Some traders also compare shorter and longer moving averages.
For example:
20-period average above 50-period average
may indicate stronger recent prices relative to the longer average.
However, moving averages are calculated from past prices.
They lag rather than predict.
A crossover that looks clear after a trend develops may have occurred too late to provide an attractive entry.
Momentum in Technical Analysis
Momentum describes the speed or strength of price movement.
A market can be rising while momentum weakens.
It can also be falling while downside momentum begins to slow.
Momentum indicators attempt to quantify aspects of this behavior.
Common examples include RSI, MACD and other oscillators.
Momentum can help answer questions such as:
Is the current move accelerating?
Is buying pressure weakening?
Has a market become unusually extended relative to recent behavior?
Is price making a new high while an indicator fails to confirm it?
These observations can add context, but momentum should not be interpreted mechanically.
Overbought and Oversold Do Not Mean Automatic Reversal
Some oscillators classify high readings as overbought and low readings as oversold.
Beginners sometimes interpret this incorrectly.
Overbought does not necessarily mean the market must immediately fall.
Oversold does not necessarily mean it must immediately rise.
During a strong uptrend, an oscillator can remain elevated for an extended period while price continues higher.
During a strong decline, oversold conditions can persist.
The reading describes the market's recent momentum relative to the indicator's calculation. It does not create a guaranteed reversal point.
Trend Indicators
Trend-following tools attempt to help traders determine direction and sometimes trend strength.
Moving averages are one example.
ADX and Aroon are other commonly used tools.
An Aroon indicator strategy, for example, interprets how recently price has recorded highs and lows within a chosen lookback period.
Trend tools can be useful when the market is moving directionally.
They often become less reliable in sideways conditions because price repeatedly crosses above and below their signals.
This is why identifying the market environment is often more important than simply adding more indicators.
Volatility
Volatility describes how widely or rapidly price changes.
A quiet market may produce small candles and narrow ranges.
A volatile market may move significantly over the same amount of time.
Volatility affects many trading decisions.
A 20-pip stop may be relatively wide in a quiet EUR/USD session but extremely tight during a major economic announcement.
Gold can move much more aggressively during certain global events than during calm periods.
Technical analysis for trading therefore needs to consider not only direction but also how much price is moving.
Volume and Participation
Volume attempts to measure activity, although the exact meaning depends on the market and data source.
Centralized markets can provide actual traded volume.
Decentralized markets such as spot foreign exchange do not have one single global exchange reporting total volume.
Platforms may instead provide tick-volume measures or other activity data.
Traders should understand what their platform's volume field actually represents before interpreting it.
High activity can confirm strong market interest, while declining participation may sometimes accompany weakening moves, but these relationships are not universal rules.
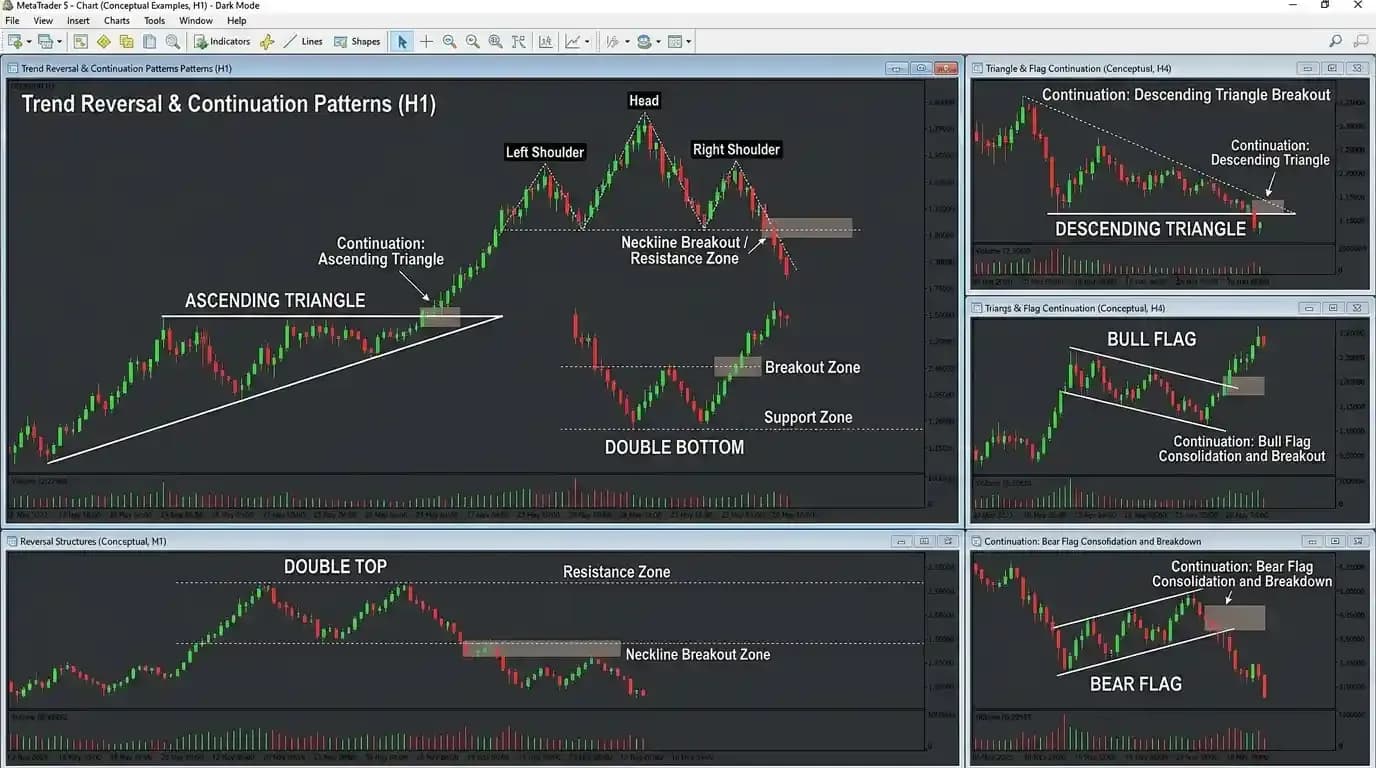
Chart Patterns
Chart patterns are recognizable structures formed by price movement.
Examples include:
- Triangles
- Double tops
- Double bottoms
- Flags
- Head-and-shoulders formations
- Wedges
- Channels
A pattern reflects how buying and selling pressure has developed over time.
The value lies in defining a market scenario, not in assuming that a named shape must behave according to a textbook diagram.
A triangle can break upward, downward or fail to produce a sustained breakout.
Pattern recognition should therefore be combined with context and risk management.
Breakouts
A breakout occurs when price moves beyond an established support, resistance or consolidation boundary.
Suppose EUR/USD repeatedly fails to move above 1.1050.
If price eventually pushes decisively above that area, traders may describe it as a resistance breakout.
A breakout can indicate changing supply and demand.
However, markets frequently produce false breakouts.
Price may trade briefly above resistance, attract breakout buyers and then fall back inside the previous range.
This is one reason confirmation rules matter.
False Signals
Every technical tool produces incorrect or misleading signals at times.
A moving-average crossover can occur immediately before the market reverses.
A support level can fail.
A breakout can return inside its previous range.
An oscillator divergence can persist while price continues trending.
Understanding technical analysis false signals is important because technical analysis becomes dangerous when traders treat signals as certainty.
A useful question is not:
"Is this signal correct?"
but:
"What evidence supports this interpretation, and what price behavior would show that it is wrong?"
Confirmation in Technical Analysis
Confirmation means looking for additional evidence before acting on one observation.
Suppose EUR/USD reaches support.
Rather than buying simply because support exists, a trader may wait for price to stop making lower lows, form a rejection candle and regain a short-term resistance area.
Another trader might combine market structure with momentum.
The concept of trading confluence refers to several independent pieces of evidence pointing toward the same broad interpretation.
More signals do not automatically make a trade better, especially when every indicator is calculated from nearly identical price data.
The goal is useful confirmation, not chart clutter.
Technical Analysis vs Fundamental Analysis
Technical analysis studies market behavior.
Fundamental analysis examines economic, financial and policy factors that may influence that behavior.
The difference is explored more fully in fundamental vs technical analysis.
For forex, fundamental factors can include interest rates, inflation, employment and central-bank policy.
A technical trader may instead focus on EUR/USD trend structure, important price levels and momentum.
These approaches can complement each other.
A trader may use economic information to understand why volatility could increase and technical levels to organize possible entries and exits.
Technical Analysis for Forex Trading
Technical analysis is widely used in forex trading because currency markets provide continuous price data across major global sessions.
A forex trader may study:
- Previous daily highs and lows
- Trend direction
- Support and resistance
- Moving averages
- Momentum
- Session ranges
- Volatility
Suppose GBP/USD has formed higher highs and higher lows on the four-hour chart.
A trader may interpret the broader structure as upward.
If price then pulls back toward previous support, the trader can evaluate whether the area still attracts buyers.
This does not guarantee a successful trade. It simply creates a logical framework for analysis.
Technical Analysis for Gold
Gold traders often combine technical levels with awareness of macroeconomic events.
Gold can react strongly to interest-rate expectations, inflation data, movements in the US dollar and geopolitical developments.
From a technical perspective, traders may watch previous highs and lows, trendlines, moving averages and areas where strong price reactions occurred.
Because gold can become highly volatile, chart levels should not be treated as exact barriers.
A sharp news-driven move can pass through several technical levels quickly.
Technical Analysis for Indices
Stock indices can trend strongly but may also experience rapid moves around major economic releases and market openings.
Technical traders may study opening ranges, prior-day highs and lows, trend structure and momentum.
For someone trading from Pakistan, US index activity frequently becomes more important later in the local day.
A trader in Peshawar, Mardan or Abbottabad who follows US markets may therefore see some of the strongest intraday movement during Pakistan's afternoon or evening hours.
The chart principles remain the same; the local schedule changes.
Pakistan Time and Technical Analysis
Technical charts are global, but the time displayed on a platform matters when interpreting sessions and candles.
A trader in Khyber Pakhtunkhwa may be using Pakistan Standard Time while the platform chart follows a different server timezone.
That can affect where four-hour candles begin and end or how a session range appears.
Someone in Peshawar, Swat, Kohat, Bannu or Mansehra should therefore know which timezone the platform uses before drawing conclusions from session-specific patterns.
A London-session breakout, for example, needs to be identified according to the actual London market period rather than an assumed local clock time.
The same issue applies when comparing charts from two different platforms.
Technical Analysis on MetaTrader 5
MetaTrader 5 provides multiple chart types, timeframes and technical indicators for supported instruments.
Traders can apply moving averages, oscillators and other tools directly to charts.
The platform makes calculation and visualization easier, but it does not decide how those tools should be interpreted.
An indicator becomes useful only when the trader understands:
- What it measures
- How it is calculated
- Which market conditions suit it
- How it can fail
- How it relates to price
Adding ten indicators without understanding them is usually less useful than understanding two or three tools properly.
Heikin-Ashi Charts
Heikin-Ashi charts use modified candle calculations to smooth some of the noise visible in conventional candlesticks.
They can make trends visually clearer.
However, Heikin-Ashi prices are calculated values and do not represent ordinary open, high, low and close data in exactly the same way as standard candles.
That makes them useful for visual trend interpretation but potentially confusing if a trader assumes every displayed price is directly tradable.
Understanding the calculation prevents misuse.
Using Multiple Indicators
Traders sometimes assume that adding more indicators improves accuracy.
This can produce the opposite result.
Suppose a chart contains RSI, MACD, stochastic oscillator and several moving averages.
Many of those tools are derived from the same underlying price information.
If all of them turn bullish at approximately the same time, this may represent one underlying price development appearing in several forms rather than four independent signals.
A cleaner chart can make decision-making easier.
Indicator Lag
Most technical indicators use historical data.
This means they respond after market movement has already occurred.
A 50-period moving average cannot know tomorrow's price. It simply summarizes the previous 50 periods according to its formula.
This lag is not necessarily a flaw.
The purpose of some indicators is to smooth noise and confirm broader behavior rather than identify the exact turning point.
Problems arise when traders mistake delayed confirmation for prediction.
A Simple Technical Analysis Example
Suppose EUR/USD is trading around 1.1000.
The four-hour chart shows:
Previous low: 1.0880
Higher low: 1.0930
Previous high: 1.1020
Current price: 1.1000
A trader could interpret the structure as broadly constructive because the recent low formed above the previous low.
The trader also notices resistance near 1.1020.
Instead of predicting an immediate breakout, two scenarios can be considered.
If price breaks above 1.1020 and maintains strength, the upward structure may continue.
If price rejects 1.1020 and falls below 1.0930, the earlier bullish structure would weaken.
This scenario-based approach is more disciplined than simply declaring that EUR/USD "will rise."
Another Example: Downtrend
Suppose GBP/USD produces:
High: 1.2900
Low: 1.2750
Lower high: 1.2840
Lower low: 1.2700
The structure contains a lower high and lower low.
A trader may therefore classify the market as downward.
If GBP/USD rallies toward 1.2800, the trader can observe whether sellers return.
If price instead moves above 1.2900 and maintains strength, the original downtrend interpretation may need to be reconsidered.
Technical analysis works best when traders are willing to update their view as price changes.
Common Technical Analysis Mistakes
One of the most common technical analysis mistakes is searching for a signal before understanding the market environment.
A trader may see an oscillator reach oversold territory and immediately buy, even though the market is in a powerful downtrend.
Another mistake is drawing too many levels.
If every small high and low becomes support or resistance, the chart eventually contains a line at almost every price.
Indicator stacking is another problem.
Using several tools that measure essentially the same thing can create false confidence.
Traders also make mistakes by changing the rules after entering a position. A support level that was supposed to invalidate the trade suddenly becomes "long-term support" after price breaks it.
Technical analysis is more useful when the conditions for being wrong are defined beforehand.
Technical Analysis and Risk Management
A technically strong setup can still lose.
This means chart analysis should be combined with position sizing and risk control.
Suppose a trader identifies a high-quality EUR/USD setup with an intended stop 40 pips away.
The quality of the setup does not determine how much account capital should be risked.
A very large position can turn an ordinary losing trade into a serious account loss.
Technical analysis determines where an idea may make sense.
Risk management determines how damaging it can be when that idea fails.
Technical Analysis and Trading Orders
After identifying a setup, the trader still needs an execution method.
A market order may be appropriate if participation is needed immediately.
A limit order may suit a planned pullback entry.
Other pending orders can be used when a trader wants price to confirm a breakout first.
Good analysis and poor execution can still produce a poor trade.
The technical view, entry method, position size and exit plan should therefore work together.
How Beginners Can Build a Technical Analysis Routine
A simple routine is usually more useful than trying to analyze everything at once.
Start by identifying the broad market condition.
Is price trending upward, trending downward or ranging?
Then mark a few meaningful highs, lows, support areas and resistance zones.
Check the timeframe above the trading timeframe for broader context.
Observe momentum and volatility.
If an indicator is used, understand what it adds to the information already visible in price.
Finally, define what would invalidate the trade idea before considering an entry.
That sequence keeps the analysis focused on decisions rather than decoration.
Technical Analysis Checklist
Before considering a trade, a trader might ask:
What is the broader trend?
Where are the important recent highs and lows?
Is price near support or resistance?
Is the market trending or ranging?
Is volatility normal or unusually high?
Is a major economic announcement approaching?
Does the lower timeframe agree with the broader structure?
What price movement would invalidate the idea?
How much financial risk would the position create?
The answers do not guarantee a profitable trade, but they produce a more disciplined analysis.
Technical Analysis in Khyber Pakhtunkhwa
A trader in Peshawar sees the same EUR/USD, gold or global-index price movement as another participant following the same underlying instrument elsewhere.
The practical difference is often timing.
London activity becomes important during Pakistan's daytime, while US markets and economic releases frequently extend into the evening.
For traders in Mardan, Abbottabad, Swabi, Nowshera, Kohat, Bannu, Dera Ismail Khan or other parts of KPK, this makes session selection part of a realistic trading routine.
If a trader can monitor markets only during particular hours, technical analysis should focus on instruments and timeframes that fit that schedule rather than forcing a strategy designed for another session.
Reliable connectivity also matters when managing short-term positions. A setup that requires constant monitoring may not be appropriate when internet access is inconsistent.
Technical Analysis Does Not Require Constant Trading
One useful feature of chart analysis is that it can also tell a trader when conditions are unclear.
A market may be stuck between support and resistance.
Trend indicators may be flat.
Price may be erratic ahead of an important announcement.
There is no requirement to turn every chart into a trade.
Sometimes the most accurate technical conclusion is that the market does not currently provide a sufficiently clear setup.
Waiting is also a trading decision.
Technical Analysis FAQs
What is technical analysis for trading?
Technical analysis for trading studies price behavior, trends, chart structure, momentum, volatility and indicators to help traders interpret current market conditions and plan possible trades.
Does technical analysis predict future prices?
No. It uses historical and current market data to build scenarios and identify probabilities, but it cannot determine future prices with certainty.
What is the most important part of technical analysis?
Price structure is one of the most important foundations. Understanding trends, highs, lows, support and resistance makes indicators easier to interpret.
What is support?
Support is an area where declining price has previously attracted buying pressure or slowed its fall.
What is resistance?
Resistance is an area where rising price has previously encountered selling pressure or difficulty continuing higher.
Are support and resistance exact prices?
Usually they are better treated as areas rather than perfect single-price barriers because markets can move slightly through previous levels before reacting.
What is a trend?
A trend is sustained directional price movement. Uptrends commonly form higher highs and higher lows, while downtrends commonly form lower highs and lower lows.
What is a moving average?
A moving average smooths price data by calculating an average over a chosen number of periods. Traders use it to help assess direction and trend behavior.
Which moving average is best?
There is no universally best moving average. Different periods and calculation methods respond differently and suit different timeframes and trading approaches.
What are momentum indicators?
Momentum indicators attempt to measure the speed or strength of market movement. Examples include RSI and MACD.
Does overbought mean I should sell?
No. An overbought reading can persist during a strong uptrend and does not guarantee that price will reverse.
Does oversold mean I should buy?
No. Oversold conditions can persist while a market continues falling.
Can technical indicators give false signals?
Yes. Every indicator can produce misleading or unsuccessful signals, particularly when market conditions change.
Is technical analysis useful for forex?
Yes. Technical analysis is widely applied to currency pairs, although traders should also be aware of economic events and other factors that can cause sharp forex movements.
Can technical analysis be used for gold?
Yes. Gold traders commonly analyze trends, support, resistance, momentum and volatility, often alongside awareness of macroeconomic events.
Can technical analysis be used for indices?
Yes. Price structure, trends and indicators can be applied to supported index markets, although volatility can increase around market openings and major economic releases.
Does technical analysis work differently in Pakistan?
The underlying chart principles are the same. Traders in Pakistan need to account for local time when following London, New York and Asian sessions.
Is technical analysis different for traders in KPK?
The analytical principles do not change. A trader in Peshawar, Mardan, Abbottabad or another KPK city follows the same underlying market data, while local schedule and connectivity may affect which timeframes are practical.
Which timeframe should beginners use?
There is no single correct timeframe. Beginners often find higher timeframes easier to interpret because they contain less short-term noise, but the choice should match the intended holding period.
Can I use more than one timeframe?
Yes. Traders often use a higher timeframe for broader context and a lower timeframe for more detailed entry analysis.
How many indicators should I use?
There is no required number. A small set of indicators that measure genuinely different aspects of the market is usually easier to interpret than a chart crowded with overlapping tools.
Can technical analysis guarantee profitable trading?
No. Even well-structured analysis can fail because markets are uncertain. Position sizing and risk management remain necessary.
What should a beginner learn after technical analysis basics?
Useful next subjects include support and resistance, chart timeframes, moving averages, momentum indicators, trend indicators, volatility, market structure and risk management.
Disclaimer: Technical analysis, indicators and chart patterns describe historical and current market behavior; they do not guarantee future price direction or profitable results. False breakouts, changing volatility and unexpected market events can invalidate even well-structured technical setups, while leverage can magnify losses. This material is provided for general education and is not individualized investment, trading, financial, legal or tax advice. Available instruments, platform features, spreads, margin requirements and other Medatiq trading conditions may vary or change.
Trade forex, gold, and indices with Medatiq Markets
Enjoy tight spreads and fast execution, built for market condition.