Candlestick Patterns: Complete Guide for Traders
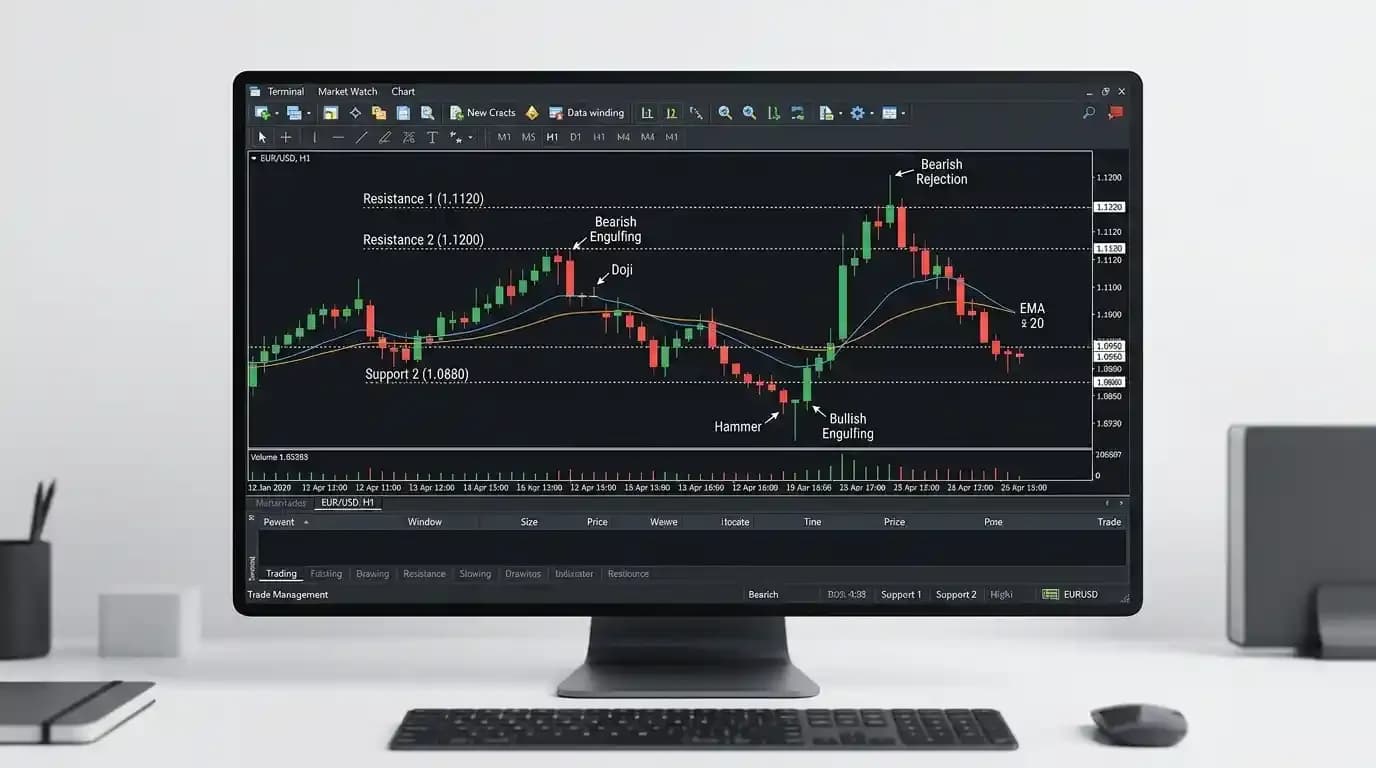
Candlestick patterns help traders interpret how price moved within individual chart periods and how buyers and sellers behaved around important market areas. Each candle contains four basic prices—the open, high, low and close—and the relationship between those values can reveal whether buyers controlled most of the period, sellers dominated, price was heavily rejected from one side, or neither side maintained a clear advantage. When several candles form together, traders can observe changes in momentum, failed attempts to move through support or resistance, temporary indecision and possible shifts in market structure. However, candlestick patterns are not reliable simply because a recognizable shape appears on a chart. A bullish engulfing candle formed at meaningful support after a controlled decline has a different context from the same shape appearing randomly in the middle of a sideways market. Likewise, a doji near major resistance can deserve attention without automatically predicting a reversal. Candlestick patterns become most useful when they are combined with trend direction, support and resistance, volatility, participation and a clear understanding of the timeframe being traded.
The broader framework of technical analysis for trading helps explain why candle location matters so much. A pattern describes what happened during one or several periods, but the surrounding market structure determines whether that information is important. Traders therefore gain more from understanding what candles represent than from memorizing dozens of pattern names.
What Is a Candlestick?
A candlestick is a visual representation of price movement during a selected period. On a one-minute chart, each candle represents one minute of activity. On a one-hour chart, it represents one hour. A daily candle summarizes one trading day according to the platform's candle construction. Regardless of timeframe, a standard candlestick normally contains the open, high, low and close. The body shows the relationship between opening and closing prices, while the upper and lower shadows show how far the market moved beyond the body during the period.
Suppose EUR/USD opens at 1.1000, trades as high as 1.1040, falls to 1.0980 and closes at 1.1030. The candle records all four values. The body extends from 1.1000 to 1.1030 because those are the opening and closing levels, while the shadows show that price temporarily reached 1.1040 above and 1.0980 below. One candle therefore contains more information than a line connecting closing prices alone.
Bullish and Bearish Candles
A bullish candle generally closes above its opening price. A bearish candle closes below its opening price. The visual convention used to display them can vary between platforms because traders can customize chart colors, so the underlying open-close relationship matters more than whether a candle happens to appear green, red, white or black.
A large bullish body can indicate that buyers maintained substantial control during the period, but even that interpretation needs context. If the candle appears after a long rally directly below major resistance, it may represent late buying rather than the beginning of a fresh trend. A large bearish candle can show strong selling during the period, yet the same candle appearing after an extended decline into major support may be followed by stabilization rather than continued collapse. Candlestick patterns should therefore be interpreted through market location and structure rather than color alone.
Candlestick Body Size
The size of the candle body helps describe the relationship between opening and closing prices. A large body indicates that price closed relatively far from where the period began. A small body indicates that the open and close were close together.
Suppose GBP/USD opens at 1.2800 and closes at 1.2900. The 100-pip body shows substantial net movement during the period. If it instead opens at 1.2800 and closes at 1.2805 after trading widely in both directions, the small body indicates that the period ended almost where it started despite significant intraperiod activity.
Body size becomes more meaningful when compared with surrounding candles. A candle that looks large in isolation may actually be normal in a highly volatile market, while the same absolute movement could be exceptional during quiet conditions. This is where volatility indicators can provide additional context.
Candlestick Shadows
The upper and lower shadows, sometimes called wicks, show prices reached during the period but not maintained into the close. Long shadows can reveal rejection from particular areas.
Suppose gold opens at 2,500, rises to 2,530, falls back and closes at 2,505. The long upper shadow shows that buyers pushed price substantially higher but could not maintain most of the advance. Sellers became active enough to return the market close to its opening level before the period ended.
That behavior can be important near resistance because it shows that higher prices were tested and rejected. The same long upper shadow in the middle of an unstructured range may carry much less information. The candle tells traders what happened, but location determines why it may matter.
Why Candlestick Patterns Form
Candlestick patterns form because buying and selling pressure changes during the period. A long bullish candle shows that the market closed substantially above its open, while a doji can indicate that the period ended near where it began after buyers and sellers failed to maintain a decisive advantage. An engulfing pattern shows a significant change in body relationship from one candle to the next, while a hammer can show strong rejection from lower prices.
These formations are not mysterious symbols. They are visual descriptions of market behavior. Understanding the underlying price action makes them easier to interpret and reduces the temptation to treat pattern names as automatic predictions.
Candlestick Patterns and Market Context
Context is the most important part of candlestick analysis. Consider a bullish engulfing pattern. If it appears after a controlled pullback into established support within a larger uptrend, the pattern can support the idea that buyers are returning. If the same pattern appears directly beneath major resistance after an extended rally, its meaning becomes much less convincing.
The same principle applies to bearish patterns. A bearish engulfing candle after a strong rally into resistance can deserve attention, while one appearing after a large decline into support may simply represent continued volatility within an already extended move.
Understanding support and resistance is therefore more important than memorizing an isolated catalogue of candles.
Single-Candle and Multi-Candle Patterns
Some candlestick patterns consist of one candle, while others require two or more periods. A doji, hammer and gravestone doji can be identified from one candle's structure. Bullish and bearish engulfing patterns require at least two candles because their interpretation depends on the relationship between consecutive bodies. Other formations may combine three or more candles.
The number of candles does not determine reliability. A three-candle formation is not automatically stronger than a one-candle rejection. What matters is whether the pattern provides meaningful information about price behavior at an important location.
Bullish Engulfing Pattern
The bullish engulfing candlestick pattern is a two-candle formation in which a bullish second candle has a real body that engulfs the preceding bearish candle's body under the conventional definition. It can indicate a sharp shift from selling pressure toward buying pressure.
Suppose EUR/USD is declining toward support. One candle closes bearish. The next period opens near or below the previous close and then rallies strongly enough for its bullish body to cover the prior bearish body. The price action shows that buyers reversed much of the previous period's selling and finished with greater control.
The pattern becomes more meaningful when it forms after a decline or pullback. A bullish engulfing candle appearing after an already extended rally does not carry the same reversal logic because there is little preceding bearish movement to reverse.
How to Interpret Bullish Engulfing
A bullish engulfing pattern should not be treated as an automatic instruction to buy. Traders can first ask whether the market is near support, whether the broader trend favors the setup, whether the engulfing body is significant relative to surrounding candles and whether price confirms the change afterward.
Suppose EUR/USD reaches support around 1.0900 and forms a bullish engulfing pattern. The next candle then breaks above a nearby short-term high. This continuation provides more evidence than the engulfing shape alone.
If EUR/USD instead forms the pattern but immediately falls below support, the bullish interpretation has failed. Price confirmation matters more than the pattern's textbook appearance.
Bearish Engulfing Pattern
The bearish engulfing candlestick pattern represents the opposite shift. A bearish second candle's body engulfs the preceding bullish body, showing a strong transition from buying toward selling pressure.
Suppose GBP/USD is rising toward resistance. A bullish candle forms near the level, but the next candle reverses sharply and closes well below the previous opening area. Sellers have overwhelmed the preceding bullish body.
The pattern may be significant if it occurs after an advance into resistance, particularly when momentum is already weakening. However, the pattern can fail if buyers quickly regain control and price moves above the engulfing high.
Trading a Bearish Engulfing Pattern
The dedicated discussion of how to trade a bearish engulfing pattern goes beyond simply recognizing the two candles. A practical approach needs to consider where the formation appears, how the broader trend is structured, where the idea becomes invalid and whether the available reward justifies the risk.
For example, a bearish engulfing candle forming directly at previous resistance may provide a logical invalidation area above the pattern high. The trader can then compare that distance with the potential downside objective. If the stop needs to be extremely wide relative to the expected target, the pattern may not provide an attractive trade even if the technical interpretation is reasonable.
Doji Candlestick
The doji candlestick pattern forms when opening and closing prices are equal or very close to one another. The candle can have substantial shadows despite its small body.
A doji indicates that the market ended near its starting point for the period. Buyers may have pushed price higher and sellers lower, yet neither side maintained a decisive net advantage into the close.
This is often described as indecision, but the term should not be exaggerated. A doji does not mean that every participant is uncertain. It simply records a close near the open.
Its importance comes from where it appears. A doji after a long trend can indicate a pause or changing balance, while one inside a quiet range may be entirely ordinary.
Doji After an Uptrend
Suppose gold has risen strongly for several sessions and reaches major resistance. A doji forms with a long upper shadow. Buyers pushed above the opening price but failed to maintain those gains.
The candle may suggest that the strong upward movement is no longer as one-sided as before.
That does not prove a reversal. The next session could break resistance and continue higher.
A cautious trader may therefore wait to see whether gold begins forming lower highs, breaks nearby support or produces further bearish confirmation before treating the doji as evidence of a meaningful trend change.
Doji After a Downtrend
A doji can also appear after a strong decline. Suppose GBP/USD falls into long-term support and forms a candle with nearly identical opening and closing prices after substantial intraday movement.
The candle shows that sellers were unable to maintain a decisive close below the opening area despite continued pressure.
If the next period breaks above short-term resistance, the setup becomes more interesting as a possible reversal.
If GBP/USD instead falls to new lows, the doji was simply a pause inside the decline.
Dragonfly Doji
The dragonfly doji candlestick pattern generally has an open and close near the high of the candle, with a long lower shadow and little or no upper shadow. It shows that price moved considerably lower during the period but recovered most or all of that decline before closing.
Near support, this can indicate strong rejection of lower prices. Sellers were initially able to push the market downward, but buyers regained control before the period ended.
The pattern is less significant when it forms in the middle of a random range. Its interpretation depends on whether the rejected lower prices were technically important.
Gravestone Doji
The gravestone doji candlestick pattern usually has the open and close near the low of the candle, with a long upper shadow.
Price rose substantially during the period but failed to maintain those higher levels.
Near resistance after an uptrend, this can show rejection from higher prices and increased selling pressure.
As always, the formation does not guarantee reversal. A strong trend can briefly reject a level and then break above it on the next attempt.
Confirmation from market structure is more important than the dramatic appearance of the wick.
Evening Doji Star
The evening doji star candlestick pattern is a multi-candle bearish reversal formation typically discussed after an uptrend. It includes a strong bullish candle, a doji-like period showing reduced directional conviction and then a bearish candle that confirms selling pressure.
The logic behind the pattern matters more than perfect textbook geometry. Buyers initially control the market. Their progress then stalls. Sellers subsequently take over enough to push price meaningfully lower.
When this occurs near resistance or after an extended trend, it can provide more context than a single doji. If price quickly recovers, however, the bearish interpretation weakens.
Hammer Candlestick Pattern
The hammer candlestick pattern normally has a relatively small body near the upper part of its range and a long lower shadow. It commonly attracts attention after a decline.
Suppose EUR/USD falls toward support, trades sharply lower during a period and then recovers before the close. The long lower wick shows that sellers pushed price down but were unable to maintain those levels.
A hammer near support can therefore indicate rejection of lower prices.
The pattern is not automatically bullish in every location. A hammer-shaped candle in the middle of an uptrend may simply reflect ordinary volatility. Context determines whether the rejection is meaningful.
Long-Wick Candles
Long wicks can provide useful information even when the candle does not match a famous named pattern. A long upper wick shows rejection from higher prices, while a long lower wick shows rejection from lower prices.
Suppose an index repeatedly tests resistance and each attempt produces a long upper shadow. Buyers continue reaching the level but cannot maintain prices above it. The repeated rejection can strengthen the significance of the resistance area.
Likewise, several long lower shadows around support can indicate that sellers repeatedly fail to sustain lower prices.
The broader principle is more important than naming every candle: watch where price traveled and where it ultimately closed.
Small-Body Candles
Small bodies indicate that the opening and closing prices were relatively close together. This can happen during consolidation, indecision or a temporary pause.
A series of small candles after a strong trend may indicate declining momentum and lower volatility. The market could be preparing for another trend leg, a reversal or a prolonged range.
The candles themselves cannot determine which outcome comes next.
Combining body size with volume indicators trading can sometimes add useful context. If price compresses into small candles while activity also declines, the market may be entering a quieter phase. A later expansion in both range and participation can indicate that conditions are changing.
Large-Body Candles
A large candle body indicates substantial net price movement during the period. Large bullish candles can appear during breakouts, strong trends and news-driven moves. Large bearish candles can occur during breakdowns, panic selling or powerful downward trends.
A large body is not always a good entry signal. Traders often make the mistake of buying after a very large bullish candle simply because the move looks strong. The market may already be extended far from support, creating poor entry location despite impressive momentum.
Similarly, shorting after an enormous bearish candle can mean entering after much of the move has already occurred.
Candlestick analysis should distinguish between information about strength and information about entry quality.
Candlestick Patterns and Trend
Trend direction changes how patterns should be interpreted. A bullish reversal candle within a broader uptrend after a temporary pullback can have a different probability profile from the same candle appearing against a powerful downtrend.
Suppose EUR/USD is above a rising moving average and continues forming higher highs and higher lows. Price pulls back toward support and produces a bullish engulfing candle. The pattern aligns with the broader trend.
Now suppose GBP/USD is in a strong downtrend and forms the same bullish engulfing pattern in the middle of the decline without meaningful support. The trade would require fighting the dominant structure.
Understanding trend indicators can help place candlestick formations within broader directional conditions.
Candlestick Patterns and Moving Averages
Moving averages trading can provide trend context while candlesticks help describe the immediate reaction around the average.
Suppose EUR/USD remains above a rising 50 EMA. Price pulls back toward the average and forms a hammer with a long lower wick. The market then closes back above the EMA.
The moving average shows that the broader trend has been upward, while the hammer shows that lower prices were rejected during the pullback.
Neither observation guarantees continuation. If price subsequently breaks below the hammer low and the broader support structure, the bullish interpretation fails.
Moving Average Slope and Candlestick Context
The moving average slope can provide another layer of directional context. A rising average suggests recent prices are generally increasing, while a falling average reflects declining prices.
A bullish candle pattern forming while the average is sharply rising can align with the established direction. The same pattern appearing while the average is falling steeply represents a potential countertrend setup and may need stronger confirmation.
The moving average should not override price action, but its slope helps show whether the candle pattern agrees with or opposes the recent broader trend.
Candlestick Patterns and Support
Candlestick patterns become particularly useful around support because they show how price responds when buyers are expected to become more active.
Suppose GBP/USD approaches a support zone around 1.2700. Price trades below the level during the session but closes back above it with a long lower wick.
The candle reveals that sellers temporarily broke support but failed to maintain the move.
If the next candle then closes higher and short-term structure turns bullish, the rejection becomes more meaningful.
If price immediately falls through 1.2700 again, the candle was simply temporary buying within a continuing decline.
Candlestick Patterns and Resistance
Resistance provides the opposite context. Suppose EUR/USD rallies toward 1.1100, a level that previously produced several declines. Price briefly trades at 1.1120 but closes at 1.1080, leaving a long upper wick.
The candle shows rejection above resistance.
A following bearish engulfing candle would provide additional evidence that sellers have become more active.
However, if EUR/USD breaks 1.1120 on the next candle and continues higher, the rejection did not produce a lasting reversal.
Candlestick patterns identify changing behavior, not permanent market barriers.
Candlestick Patterns and Breakouts
Candles can help distinguish strong breakouts from weak attempts, although no candle guarantees continuation.
Suppose resistance lies at 1.1050. EUR/USD forms a large bullish candle that opens below the level, breaks above it and closes near the candle high at 1.1080. The strong close suggests that buyers maintained control through the breakout period.
A breakout candle that moves above 1.1050 but closes back at 1.1040 with a long upper wick tells a very different story. Higher prices were tested but rejected.
The candle close relative to the broken level can therefore provide useful information about whether the market accepted or rejected the breakout.
False Breakouts and Candlesticks
False breakouts often create distinctive rejection candles. Price moves beyond an obvious level, attracts breakout traders and then reverses before the candle closes.
Suppose gold trades above resistance at 2,500 and reaches 2,525, but the period ends at 2,490. The long upper wick and close back below resistance show that the breakout failed during that candle.
This does not guarantee a larger decline, but it gives traders a clear technical event to evaluate.
The significance increases if subsequent candles remain below resistance and begin forming lower highs.
Candlestick Confirmation
Confirmation means waiting for additional price evidence after a pattern forms. A bullish candle can be confirmed by price breaking above its high or changing short-term market structure. A bearish pattern may become more convincing when price breaks support or begins producing lower highs.
There is a trade-off. Waiting for confirmation can reduce premature entries, but it often means entering at a less favorable price because part of the move has already occurred.
Entering immediately provides better price location if the pattern succeeds but greater risk that the pattern fails.
There is no universal answer. The trader needs a consistent method appropriate to the strategy and timeframe.
Candlestick Patterns and Volume
Volume can add information about participation behind a candle. Suppose a bullish engulfing pattern forms at support during unusually high activity. The strong candle and increased participation may together provide more evidence than the shape alone.
However, high volume does not automatically make the pattern successful. Extremely high activity can also appear during exhaustion or chaotic news-driven trading.
Similarly, a low-volume reversal pattern may still succeed when sellers or buyers simply disappear from the market.
Volume adds context rather than certainty.
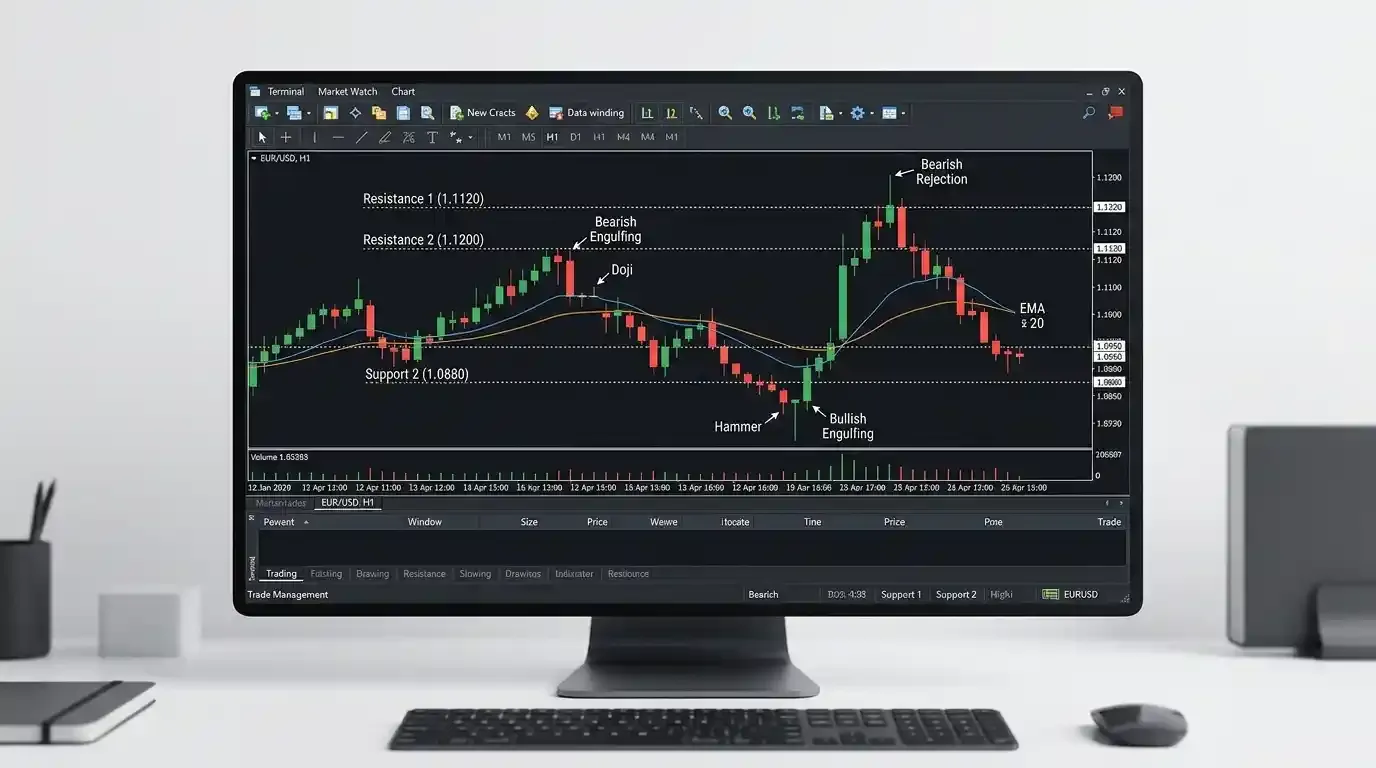
Candlestick Patterns and Momentum
Candlestick behavior can also be compared with momentum indicators. Suppose price reaches resistance while upward momentum is weakening. A bearish engulfing candle then develops at the level.
The pattern aligns with the declining momentum.
That combination can create a stronger case for caution than either observation alone.
If momentum remains exceptionally strong despite the bearish candle, the trader may want more confirmation before assuming a reversal.
The most useful combinations involve different types of information rather than several indicators repeating the same price movement.
Candlestick Patterns and Volatility
Volatility strongly affects candle size. A 20-pip EUR/USD candle may be unusually large during a quiet period and completely ordinary during a major economic event.
This means candlestick patterns should be compared with surrounding candles and recent market conditions.
A hammer with a 40-pip range may look dramatic, but if hourly ATR is 60 pips, the candle may not be particularly exceptional. If hourly ATR is only 10 pips, the same candle represents a major volatility event.
Without volatility context, traders can overestimate the significance of visually large patterns.
Candlestick Patterns Across Timeframes
The same candlestick pattern can have different significance depending on timeframe. A bullish engulfing formation on a one-minute chart represents two minutes of price behavior. The same pattern on a daily chart summarizes two entire trading days.
Higher-timeframe candles generally contain more underlying market activity and are often used for broader structural analysis. Lower-timeframe patterns can provide detailed entry information but also contain more short-term noise.
A trader might identify daily support and then use an hourly candlestick pattern to refine an entry. This approach connects broader structure with lower-timeframe behavior rather than treating every small candle as equally important.
Line Charts vs Candlestick Charts
The comparison between a line chart vs candlestick chart illustrates how much additional information candlesticks provide. A conventional line chart usually connects closing prices, creating a clean view of broader direction while hiding intraperiod highs, lows and opening prices.
Candlesticks preserve those details.
A line chart might show that EUR/USD closed at nearly the same level for two consecutive days. Candlesticks could reveal that the second day traded 100 pips higher before reversing, information that is invisible on a close-only line.
Neither chart type is inherently superior for every task. Candlesticks are particularly useful when intraperiod rejection and price structure matter.
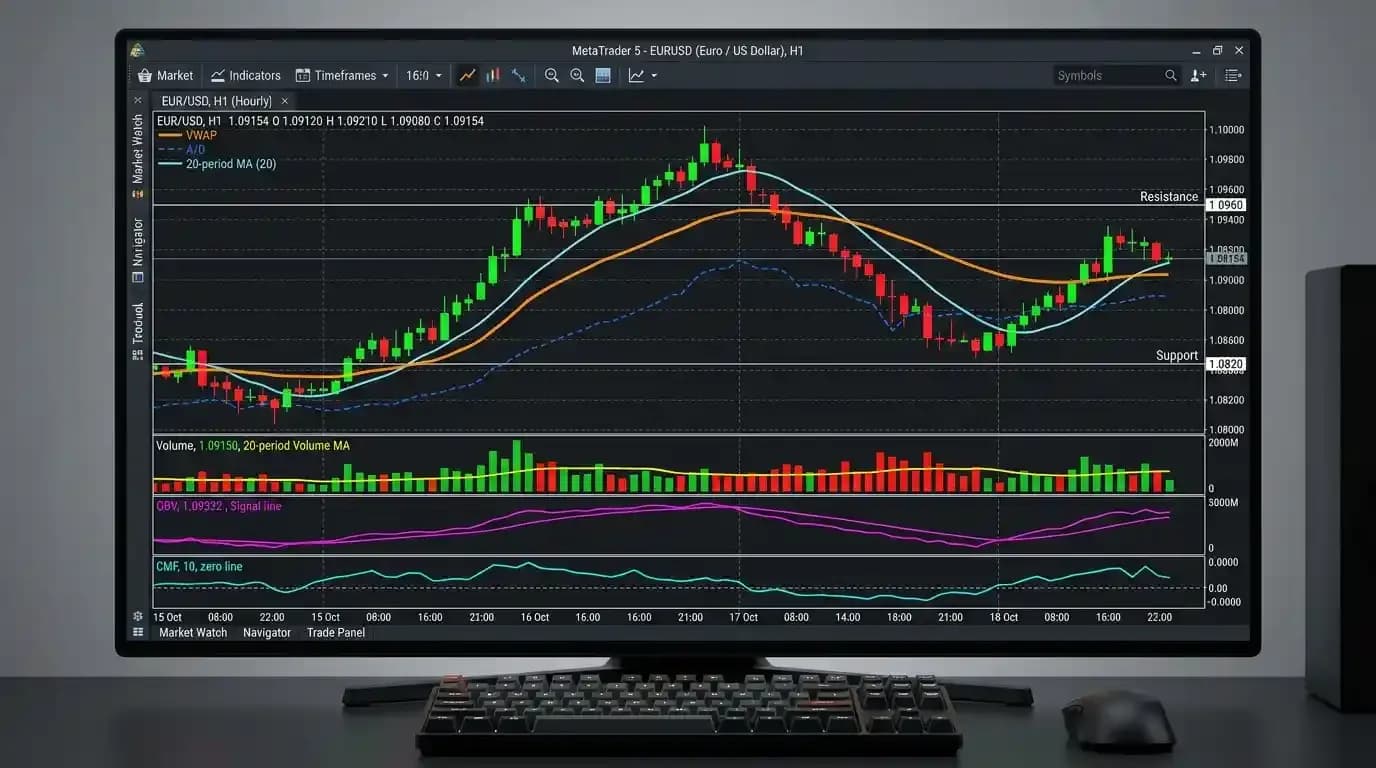
Candlestick Patterns on MetaTrader 5
Traders can view standard candlestick charts on the MetaTrader 5 platform for supported instruments. Chart timeframe, zoom level and server time affect how candles appear.
Before analyzing a pattern, traders should know when the candle begins and ends. A four-hour candle on one platform may have different boundaries from a four-hour candle on another if the server time differs. This can change the appearance of multi-candle formations even when both platforms reflect broadly similar market prices.
The underlying market movement has not necessarily changed; the data has simply been grouped into different time intervals.
Candlestick Patterns in Forex Trading
Candlestick patterns are widely used in forex trading because currency charts provide continuous price behavior across major global sessions.
A trader may use daily candles to understand broader EUR/USD structure and shorter timeframes to observe reactions during London or New York trading.
Forex traders should remember that candles can change dramatically around economic releases. A clean-looking reversal pattern formed immediately before important inflation or central-bank data can be invalidated within seconds once new information reaches the market.
The pattern cannot anticipate news that has not yet occurred.
Candlestick Patterns in Gold
Gold frequently produces strong rejection candles around major price levels because the market can move rapidly in response to macroeconomic and geopolitical developments.
A long upper wick near resistance can indicate rejection, while a hammer near support can show strong recovery from lower prices.
However, gold's volatility means candle ranges can become unusually large. Traders should therefore assess the pattern relative to recent volatility rather than assuming a dramatic-looking candle always represents an exceptional signal.
Candlestick Patterns in Indices
Index traders often use candlestick patterns around previous session highs and lows, opening ranges and major technical levels. Market-opening volatility can produce large candles quickly, particularly in US indices.
For traders in Pakistan, the most active US index periods often occur later in the local day. A candle formed during the active market open may contain significantly more information and volatility than one formed during a quieter period.
Session context should therefore be considered before comparing candle formations across the trading day.
Candlestick Patterns in Cryptocurrency Markets
Candlestick patterns can also be applied to supported cryptocurrency instruments. The visual principles are the same: candles still represent open, high, low and close data for each period.
The challenge is volatility. Cryptocurrency markets can produce large wicks, sudden reversals and rapid breakouts, meaning textbook patterns can fail abruptly.
A hammer or engulfing formation should therefore be evaluated within the market's actual volatility, liquidity and structural context rather than assumed to be more reliable because the candle looks visually dramatic.
Candlestick Patterns and Pakistan Standard Time
Candlestick calculations do not change because a trader is located in Pakistan, but candle timing can matter. A platform may use server time that differs from Pakistan Standard Time, which determines when daily and intraday candles open and close.
A trader in Pakistan comparing charts from two brokers might therefore see slightly different four-hour or daily candle shapes even when the underlying market prices are similar.
This is particularly important when a strategy depends on exact multi-candle formations. Before deciding that one platform's pattern is correct and another is wrong, compare their candle boundaries.
Candlestick Trading in Khyber Pakhtunkhwa
For traders in Peshawar, Mardan, Abbottabad, Swat, Nowshera, Kohat, Bannu, Mansehra, Haripur, Swabi and other parts of Khyber Pakhtunkhwa, candlestick analysis works the same way as it does elsewhere. The practical difference is the timing of the international market sessions being followed.
European forex activity becomes important during Pakistan's daytime, while US markets generally become more active later. Traders using shorter candlestick timeframes need to understand which session produced the pattern because a formation during an active market period can behave differently from one appearing during thin or quiet conditions.
Those who cannot monitor markets continuously may find four-hour or daily candle analysis more manageable than strategies requiring constant attention to five-minute patterns.
Connectivity and Candlestick Trading
Very short-term candlestick strategies can develop and fail quickly. A pattern may form, confirm and reverse within several minutes.
If a trader relies on manual execution, unstable connectivity can make this type of trading harder to manage. A higher-timeframe pattern develops more slowly and usually provides more decision time, although the financial risk can still be significant.
The analytical timeframe should therefore fit practical circumstances rather than being selected only because shorter charts appear to offer more opportunities.
Common Candlestick Pattern Mistakes
The most common mistake is trading a pattern without considering where it formed. A hammer in the middle of nowhere is not equivalent to a hammer rejecting major support. Another common error is memorizing dozens of names without understanding the underlying price behavior. Traders may also treat one candle as proof of reversal, ignore the broader trend, overlook volatility or enter after an exceptionally large candle when price is already extended.
Candlestick patterns should answer a specific question about market behavior. Did price reject a level? Did buying pressure replace selling pressure? Did a breakout hold into the close? Did the market fail to maintain new highs? If the pattern does not provide useful information about the current market situation, its name adds little value.
Pattern Hunting
Pattern hunting occurs when traders scan charts until something vaguely resembles a recognized candlestick formation. Because candle shapes vary continuously, almost any chart can eventually be interpreted as containing some type of pattern.
This creates confirmation bias. A trader who wants to buy may find a hammer. Someone who wants to sell may focus on a nearby bearish candle.
A more objective approach starts with market structure. Identify the trend and important levels first. Then examine whether the candlesticks provide meaningful evidence at those locations.
The pattern should support the analysis rather than create it from nothing.
Ignoring the Broader Trend
A reversal candle against a strong trend can fail repeatedly. Suppose GBP/USD is in a powerful downtrend and forms one bullish hammer. Buying immediately assumes that one period of rejection is enough to overturn the entire directional structure.
A more cautious trader may wait for the market to stop producing lower lows and eventually break above a meaningful lower high.
The hammer then becomes part of a larger reversal sequence rather than the sole reason for the trade.
Candlestick patterns are often most reliable when they describe changes already beginning to appear in structure.
Entering After Oversized Candles
Large candles attract attention because they make market direction look obvious. A trader sees a huge bullish candle and buys at the close.
The difficulty is that the candle may already have traveled a substantial distance from support. A normal pullback can therefore create a large immediate loss despite the bullish analysis remaining broadly intact.
Before entering after an oversized candle, consider where the invalidation level is located and whether the required stop produces reasonable risk.
Strong movement and good entry location are not the same thing.
Ignoring the Candle Close
A candle's closing location is often more informative than its temporary intraperiod movement. Suppose price breaks above resistance during the period but closes below it. Treating the intraperiod breakout as fully successful ignores the rejection visible in the close.
Likewise, price may briefly fall below support but recover strongly before the candle ends.
This does not mean traders must always wait for every candle to close. Different strategies use different execution rules. It does mean that incomplete candles can change dramatically before the period ends.
A pattern is not finalized until its candle has closed.
Candlestick Patterns and Risk Management
No candle shape determines the appropriate position size. A textbook engulfing pattern can fail immediately, and a doji can be followed by a large trend continuation.
Suppose a bullish engulfing candle forms at support with a low 40 pips below the intended entry. If that low defines technical invalidation, position size should reflect the 40-pip risk rather than being chosen because the pattern looks unusually convincing.
A strong-looking pattern does not justify larger leverage.
Technical quality and financial exposure are separate decisions.
A Practical Bullish Candlestick Example
Suppose EUR/USD has been trending upward on the four-hour chart and remains above a rising medium-term moving average. The pair pulls back toward established support around 1.0950. During the decline, candle bodies become smaller and selling momentum weakens. EUR/USD then trades down to 1.0940 but recovers sharply, forming a hammer with a long lower shadow.
The next candle opens near 1.0960 and closes strongly at 1.0990, creating further bullish confirmation. Price then moves above a short-term swing high.
The useful evidence is not simply "a hammer formed." The broader trend is upward, the pattern appeared at support, lower prices were rejected and subsequent price action confirmed the reaction.
If EUR/USD instead falls below the hammer low, the original bullish interpretation should be reconsidered.
A Practical Bearish Candlestick Example
Suppose GBP/USD rallies toward resistance around 1.2850 after several days of upward movement. Momentum begins slowing near the level. Price trades to 1.2870 but closes back below 1.2840, leaving a long upper wick. The next period initially rises but then reverses sharply, forming a bearish engulfing candle.
The sequence shows repeated rejection from resistance and a shift from buying toward selling pressure.
A trader might then watch whether GBP/USD breaks the nearest higher low. If it does, the bearish case becomes stronger because market structure is beginning to confirm the candlestick behavior.
If price instead moves above 1.2870, the rejection has failed.
A Practical Doji Example
Suppose gold has risen rapidly and approaches major resistance. A daily doji forms after price trades widely in both directions but closes near the opening level.
The doji tells traders that the period ended without meaningful net progress despite significant activity.
Rather than shorting immediately, a trader waits. The next session breaks below the doji low and closes beneath nearby support.
The reversal case is now stronger because price has confirmed that sellers are gaining control.
If gold had broken above the doji high instead, the same doji could have become a temporary pause before continuation.
Building a Candlestick Analysis Routine
A practical candlestick routine begins with market structure rather than pattern names. First determine whether the market is trending or ranging and identify the most important support and resistance zones. Then consider recent volatility and the timeframe being analyzed. Once price reaches an area where a reaction would matter, examine the candles for rejection, engulfing behavior, indecision or acceleration. Compare the formation with participation and momentum when those tools add relevant information. Finally, define the price level that would invalidate the interpretation before deciding whether the trade offers acceptable risk.
This process prevents candle analysis from becoming a search for attractive shapes and turns it into a structured way to read market behavior.
Candlestick Patterns FAQs
What are candlestick patterns?
Candlestick patterns are recognizable arrangements of open, high, low and close prices that traders use to interpret changes in buying and selling behavior.
What does a bullish candlestick mean?
A bullish candle closes above its opening price. It shows net upward movement during that period but does not guarantee further gains.
What does a bearish candlestick mean?
A bearish candle closes below its opening price and shows net downward movement during the period.
What does a long upper wick mean?
A long upper wick indicates that price traded significantly higher during the period but failed to maintain much of that advance before closing.
What does a long lower wick mean?
A long lower wick shows that price moved substantially lower but recovered before the candle closed.
What is a bullish engulfing pattern?
A bullish engulfing pattern is a two-candle formation in which a bullish body engulfs the preceding bearish body under the conventional definition.
What is a bearish engulfing pattern?
A bearish engulfing pattern occurs when a bearish candle body engulfs the preceding bullish body.
What is a doji?
A doji is a candle whose opening and closing prices are equal or very close together.
Does a doji guarantee a reversal?
No. A doji can mark indecision, a temporary pause or part of a continuing trend.
What is a hammer candlestick?
A hammer normally has a small body near the upper part of its range and a long lower wick, often receiving attention after a decline.
What is a dragonfly doji?
A dragonfly doji generally has the open and close near the candle high with a long lower shadow, showing rejection from lower prices.
What is a gravestone doji?
A gravestone doji generally has its open and close near the candle low with a long upper shadow, showing rejection from higher prices.
Are candlestick patterns reliable?
They can provide useful information, but their usefulness depends heavily on market context, timeframe, volatility and confirmation.
Which candlestick pattern is most accurate?
There is no universally most accurate candlestick pattern. A well-located formation with supporting structure can be more meaningful than a famous pattern appearing randomly.
Should I trade every engulfing pattern?
No. Engulfing patterns are more useful when they form at technically meaningful locations and fit the broader market environment.
Do candlestick patterns work in forex?
Yes. Forex traders widely use candlesticks to analyze price behavior, rejection, trends and breakouts.
Do candlestick patterns work for gold?
Yes, although gold's volatility means patterns should be interpreted relative to recent ranges and market conditions.
Can candlestick patterns be used for indices?
Yes. They can be applied to supported index charts across intraday and higher timeframes.
Can candlestick patterns be used for cryptocurrency markets?
Yes, but crypto volatility can produce frequent large candles and failed formations, making risk management particularly important.
Which timeframe is best for candlestick patterns?
There is no single best timeframe. Higher timeframes generally show broader structure, while lower timeframes provide more detailed but noisier signals.
Are daily candlestick patterns stronger than five-minute patterns?
Daily patterns summarize much more market activity and are often used for broader analysis, but no timeframe guarantees a successful signal.
Should candlestick patterns be combined with support and resistance?
Yes. Pattern location around meaningful support or resistance can provide substantially more context than the candle shape alone.
Can volume confirm a candlestick pattern?
Volume can show whether participation expanded during the formation, but increased volume does not guarantee that the pattern will succeed.
Do candlestick patterns work differently in Pakistan?
No. The price behavior is the same. Traders in Pakistan mainly need to understand international session timing and the platform timezone used to construct candles.
Are candlestick patterns different for traders in KPK?
No. Traders in Peshawar, Mardan, Abbottabad, Swat or elsewhere in KPK can use the same analysis when viewing the same market data. Local trading hours and connectivity affect practical execution rather than candle mechanics.
Why do candles look different on two platforms?
Differences in price feeds, server time and candle boundaries can cause patterns to look slightly different, especially on intraday charts.
Can I trade an unfinished candlestick?
A developing candle can change substantially before it closes. Some strategies use intraperiod information, but a completed candlestick pattern is not finalized until the period ends.
Do candlestick patterns predict future prices?
No. They describe current and historical price behavior and can help form scenarios, but they cannot determine future prices with certainty.
Can candlestick patterns guarantee profitable trading?
No. Even well-positioned patterns can fail, and leveraged trading can magnify losses when the market moves against the position.
Disclaimer: Candlestick patterns describe how price behaved during one or more completed market periods, but engulfing candles, doji formations, hammers, rejection wicks and other recognizable structures cannot guarantee a reversal, breakout or trend continuation. Pattern reliability changes with market structure, volatility, liquidity, timeframe and unexpected events, while leveraged trading can amplify losses when a setup fails. This material is provided for general educational purposes and is not personalized investment, trading, financial, legal or tax advice. Medatiq's supported instruments, spreads, execution conditions, margin requirements and platform functionality may vary or change.
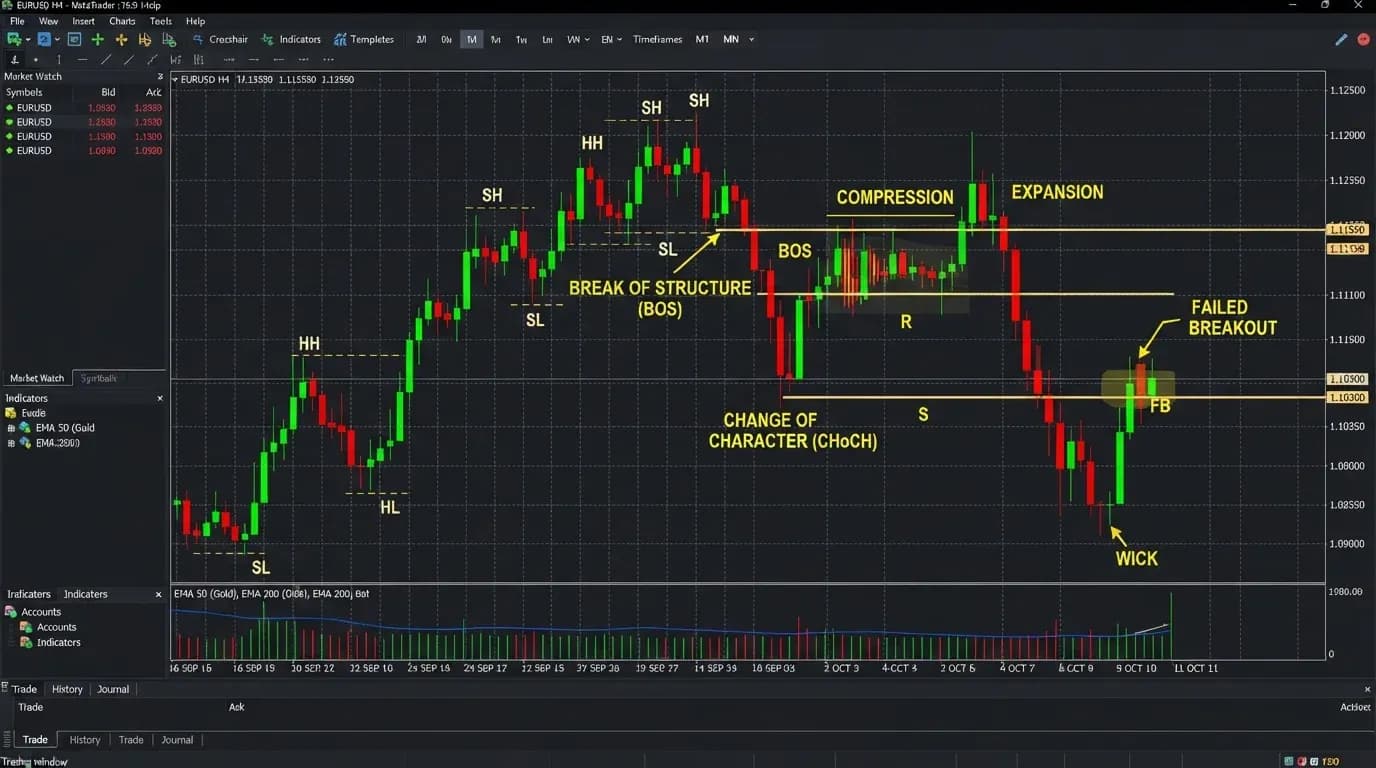
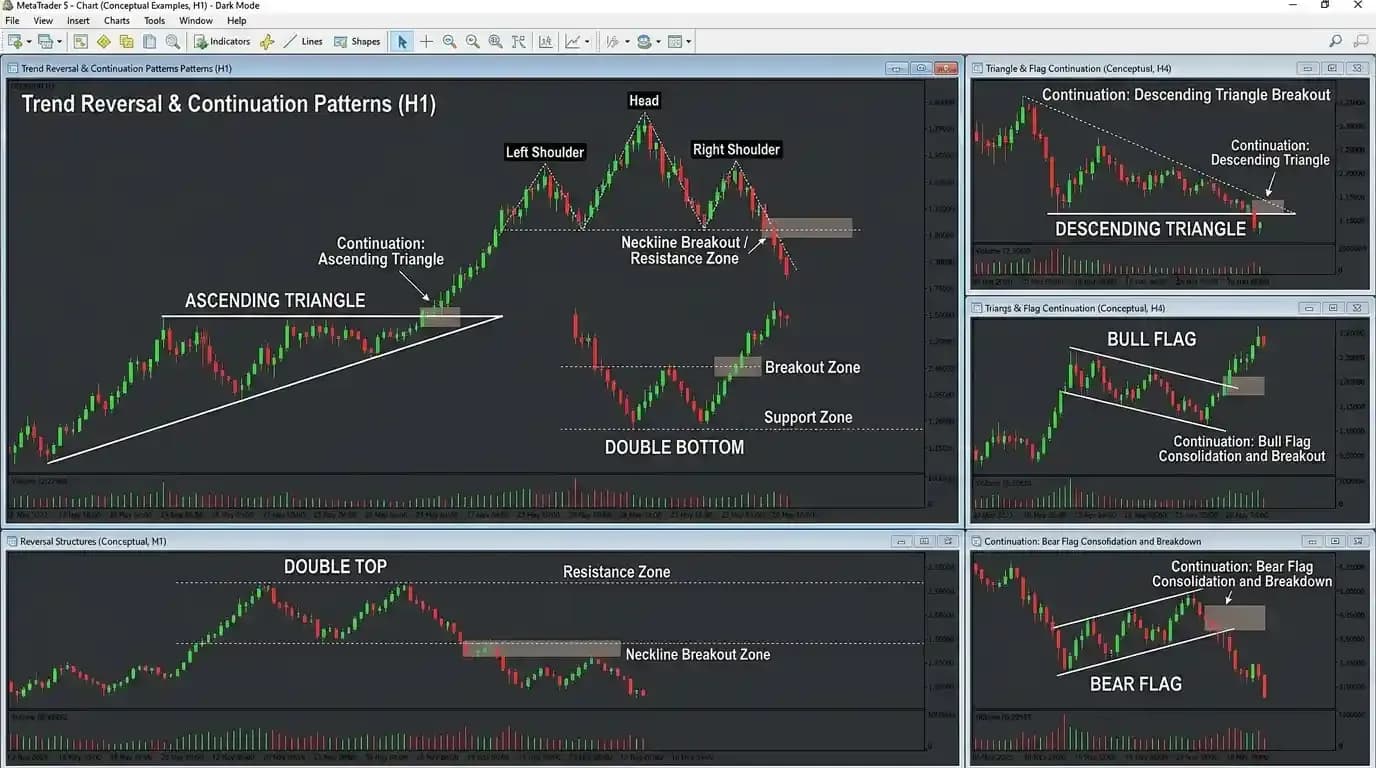
Trade forex, gold, and indices with Medatiq Markets
Enjoy tight spreads and fast execution, built for market condition.