Moving Averages in Trading: Types, Signals & Strategies
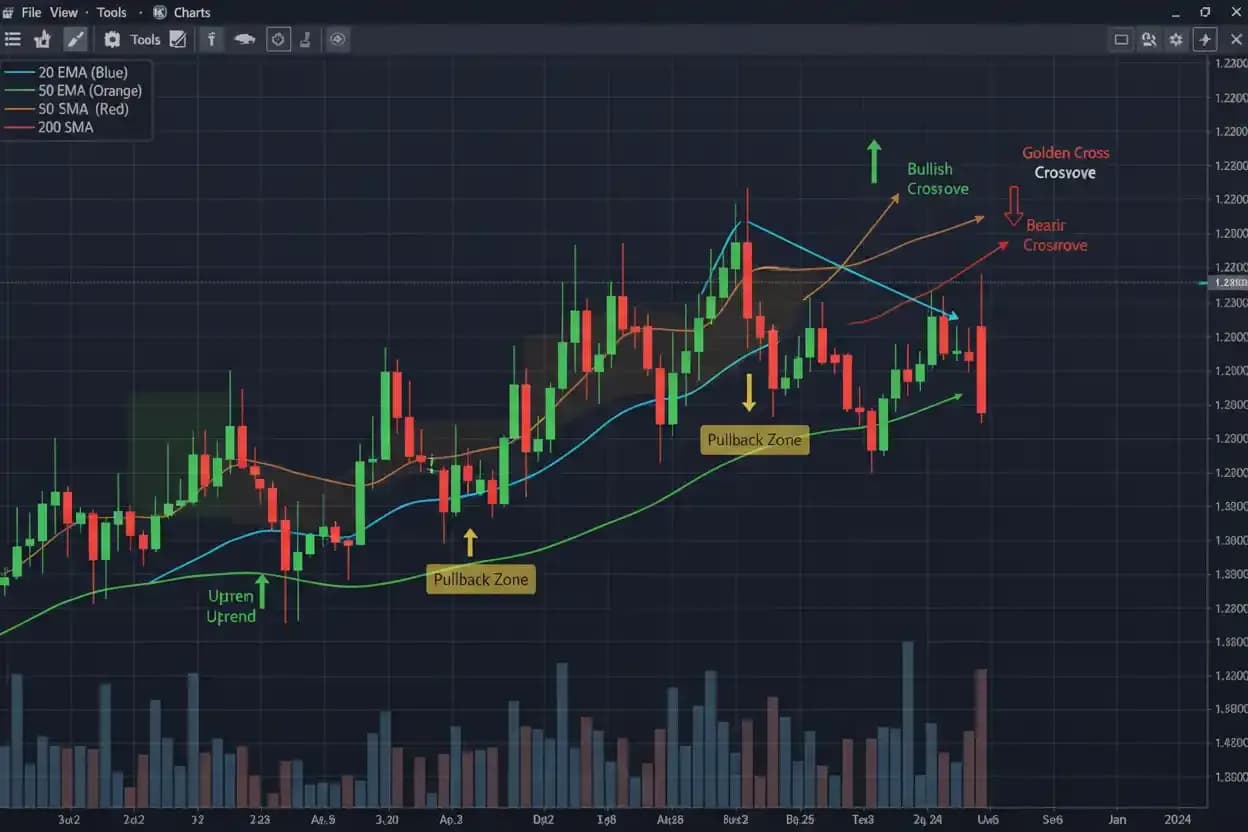
Moving averages trading helps traders reduce short-term price noise and see the broader direction of a market more clearly. A moving average calculates an average price over a selected number of periods and updates as new market data becomes available, creating a line that follows price rather than reacting to every individual candle. Traders commonly use moving averages to identify trends, compare short-term and long-term momentum, locate potential pullback areas and judge whether market conditions are strengthening or weakening. Simple moving averages and exponential moving averages are the two most familiar types, although several variations exist. Their signals can be useful in forex, gold, indices and other actively traded markets, but moving averages are based on past prices and therefore lag current market movement. They become most useful when interpreted alongside price structure, support and resistance, momentum and volatility instead of being treated as automatic buy or sell signals.
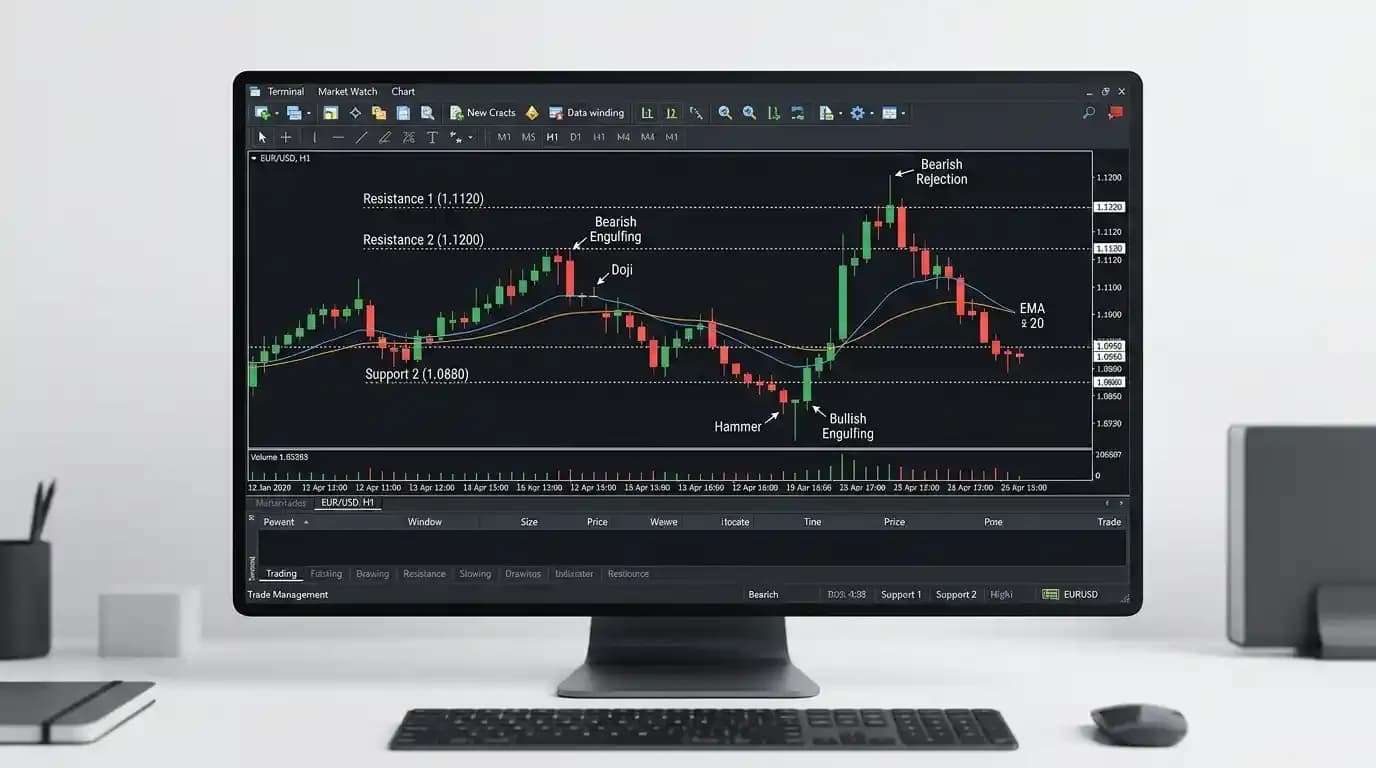
Moving averages are a core part of technical analysis for trading, particularly when a trader needs a consistent way to evaluate direction across different timeframes.
What Is a Moving Average in Trading?
A moving average is a mathematical calculation that smooths a sequence of market prices over a chosen period.
Suppose a trader uses a five-period moving average. The calculation takes the prices from the latest five periods, produces an average and plots that value on the chart.
When a new period appears, the oldest value is removed and the latest price is added.
The average therefore moves continuously with the market.
For a five-period simple moving average using closing prices:
SMA = (P1 + P2 + P3 + P4 + P5) ÷ 5
If the closing prices are:
100
102
103
101
104
then:
SMA = (100 + 102 + 103 + 101 + 104) ÷ 5
SMA = 510 ÷ 5
SMA = 102
The resulting value does not tell the trader what the next price will be. It summarizes the recent prices according to the selected calculation.
Why Traders Use Moving Averages
Raw price charts contain a large amount of short-term movement.
A market can move higher overall while producing many small declines along the way. The opposite is true during a downtrend.
Moving averages smooth some of these fluctuations, making the broader direction easier to see.
If price remains consistently above a rising moving average, traders may interpret the market as having upward momentum.
If price remains below a declining average, the broader interpretation may be bearish.
When an average becomes relatively flat and price crosses repeatedly from one side to the other, the market may be losing directional strength or moving sideways.
This makes moving averages particularly useful for identifying context before looking for a trade.
Simple Moving Average
The simple moving average, or SMA, gives equal weight to every price within the selected period.
A 20-period SMA uses the most recent 20 values.
A 50-period SMA uses 50.
A 200-period SMA uses 200.
Because every observation receives equal weighting, an older price within the calculation matters just as much as the newest one until it eventually drops out.
Longer SMAs react more slowly because one new price represents a smaller proportion of the total calculation.
This slower response can help filter short-term noise, although it also means the average takes longer to reflect changes in market direction.
Exponential Moving Average
An exponential moving average, or EMA, places greater weight on recent prices.
This makes it more responsive to new market movement than a comparable SMA.
For example, a 20 EMA will generally react more quickly to a sudden price increase than a 20 SMA.
The weighting multiplier is commonly derived as:
Multiplier = 2 ÷ (n + 1)
where:
n = number of periods
For a 20-period EMA:
Multiplier = 2 ÷ 21
Multiplier ≈ 0.0952
The current EMA then incorporates the newest price while retaining information from the previous EMA value.
The exponential moving average indicator deserves particular attention because its greater responsiveness makes it popular among traders who want to follow relatively recent changes in price.
SMA vs EMA
The main difference between an SMA and EMA is how they weight price data.
An SMA treats each observation equally.
An EMA emphasizes more recent prices.
This creates a trade-off.
An EMA can react faster when the market changes direction, but the same sensitivity may produce more false fluctuations when conditions are noisy.
An SMA responds more slowly, which can make broader trends appear cleaner, although important changes may also be recognized later.
Neither is universally better.
The useful question is whether the selected average suits the market, timeframe and purpose of the analysis.
Common Moving Average Periods
Traders use many moving average settings, but several periods appear frequently.
20-Period Moving Average
A 20-period average responds relatively quickly and is often used to follow short-term or intermediate market movement.
It can be useful for observing pullbacks during active trends.
The detailed differences between two popular short- and medium-term settings are covered in 20 EMA vs 50 EMA.
50-Period Moving Average
The 50-period moving average provides a broader view than a 20-period average.
Traders often use it to evaluate medium-term direction and compare current price behavior with a wider sample of recent market activity.
100-Period Moving Average
The 100-period average sits between commonly used medium- and long-term settings.
It is sometimes used as a trend reference or dynamic price area.
200-Period Moving Average
The 200-period moving average is one of the most widely followed longer-term references.
A market trading well above a rising 200-period average may be viewed differently from one consistently below a falling 200-period average.
The relationship between the 50 SMA vs 200 SMA is also used in several familiar crossover interpretations.
Moving Average Periods Depend on Timeframe
A "20-period moving average" does not represent the same amount of time on every chart.
On a five-minute chart:
20 periods = 100 minutes of price data
On a one-hour chart:
20 periods = 20 hours
On a daily chart:
20 periods = 20 daily candles
The mathematical period remains 20, but the market information being summarized is completely different.
This is why traders should never describe a moving average setting without considering the chart timeframe.
A 50 EMA on a five-minute chart answers a different question from a 50 EMA on a daily chart.
Using Moving Averages to Identify Trends
One of the simplest moving averages trading methods is to study the direction of the average itself.
A rising average suggests that the prices included in its calculation are generally increasing.
A falling average suggests declining prices.
A relatively flat average indicates that prices have not maintained a strong directional change over the selected period.
Traders often combine this with price location.
For example:
Price above rising average = potentially bullish context
Price below falling average = potentially bearish context
The combination is more useful than price location alone.
A market crossing above a strongly declining average does not necessarily mean an uptrend has started.
Price Above a Moving Average
When price remains above a rising moving average, traders may interpret the market as having positive directional structure.
Suppose EUR/USD has been trading above a rising 50 EMA for several sessions.
Each pullback approaches the average but buyers appear before a sustained break develops.
The moving average may then act as a useful trend reference.
However, the line itself does not support price in a physical sense.
It is calculated from previous market data.
The relevant information is that buyers have repeatedly become active around a region that happens to coincide with the moving average.
Price Below a Moving Average
A market consistently below a falling average can indicate downward pressure.
Suppose GBP/USD remains beneath a declining 50-period moving average.
Short-term recoveries repeatedly stall near the average before price continues lower.
This pattern can reinforce a bearish interpretation.
But the trader should still look at actual highs and lows.
If GBP/USD begins making higher highs and higher lows while the moving average remains downward, price structure may be changing before the lagging average catches up.
Moving averages should therefore support price analysis rather than replace it.
Moving Average Slope
The slope of the moving average can provide additional information.
A sharply rising average indicates that recent prices are increasing quickly enough to pull the calculation upward.
A gently rising line indicates slower advancement.
A flat moving average usually suggests weak directional movement.
The same applies in reverse to declining averages.
Slope is particularly useful because merely knowing whether price is above or below an average can be misleading.
A market can temporarily cross above a flat moving average many times during a range.
Moving Averages in Trending Markets
Moving averages usually look most useful when markets trend.
During an uptrend, price may remain predominantly above a rising average.
Pullbacks may approach the average before the trend resumes.
During a downtrend, price may remain below a falling average and rally toward it during temporary corrections.
These environments suit trend-following techniques because directional movement persists long enough for the moving average to reflect it.
The broader behavior of directional markets can also be studied with trend indicators.
Moving Averages in Sideways Markets
Moving averages can become much less useful during ranges.
Imagine EUR/USD trading repeatedly between 1.0950 and 1.1050.
A 20 EMA running through the middle of the range may be crossed dozens of times.
Each cross could appear bullish or bearish for a short period, yet no sustained trend develops.
This is often called a whipsaw environment.
The moving average has not stopped calculating correctly. The market condition simply does not suit a directional interpretation.
Recognizing this distinction can prevent traders from repeatedly buying and selling meaningless crosses.
Moving Average Crossovers
A moving average crossover occurs when one average moves above or below another.
Traders commonly compare a faster average with a slower one.
For example:
20 EMA
50 EMA
The 20 EMA responds more quickly to recent prices.
If it crosses above the 50 EMA, recent market behavior has become stronger relative to the longer calculation.
If it crosses below, recent prices have weakened relative to the slower average.
The crossover describes a change in relative momentum.
It does not guarantee a new trend.
Bullish Moving Average Crossover
Suppose a 20 EMA has been below a 50 EMA during a downtrend.
Price begins recovering.
As higher prices enter the shorter calculation, the 20 EMA rises more quickly.
Eventually:
20 EMA crosses above 50 EMA
Some traders interpret this as bullish confirmation.
The important word is confirmation.
Price normally has to move substantially before the averages cross, meaning part of the market move has already happened.
This is the natural lag of the indicator.
Bearish Moving Average Crossover
A bearish crossover occurs when the faster average falls below the slower one.
Suppose EUR/USD has been rising, but momentum weakens and price begins declining.
The shorter moving average reacts first.
Eventually:
20 EMA crosses below 50 EMA
This indicates that recent prices have weakened relative to the longer average.
It can support a bearish interpretation, but sideways markets can generate repeated bearish and bullish crossovers without meaningful follow-through.
Golden Cross
The golden cross generally refers to a shorter-term moving average crossing above a longer-term average, commonly the 50-period SMA moving above the 200-period SMA.
It is often interpreted as a longer-term bullish signal.
The crossover can confirm improving trend conditions.
However, because both averages use substantial historical data, the signal appears after price has already moved.
A golden cross should not be treated as proof that the market will continue rising.
Death Cross
A death cross generally describes the opposite relationship, commonly when the 50-period moving average crosses below the 200-period moving average.
It is often interpreted as evidence of weakening longer-term market structure.
Again, the signal is lagging.
By the time the crossover occurs, a significant decline may already have happened.
The market can also recover soon afterward, causing the signal to fail.
Moving Averages as Dynamic Support
During an uptrend, price sometimes repeatedly approaches a rising moving average and then rebounds.
Traders may describe the average as dynamic support.
Suppose EUR/USD is trending upward above a rising 20 EMA.
Price pulls back toward the average three times, and each pullback is followed by renewed buying.
The pattern can become useful for identifying potential continuation areas.
However, it is the behavior of buyers around the area that matters.
The moving average itself does not force a reversal.
Moving Averages as Dynamic Resistance
During a downtrend, a declining moving average may behave as a dynamic resistance reference.
Suppose GBP/USD remains below a falling 50 EMA.
Each recovery approaches the average and then loses momentum.
A trader may monitor the region for potential continuation of the broader decline.
If price eventually moves above the average and begins forming higher highs and higher lows, the market structure may be changing.
The average should then be reinterpreted rather than defended as though it cannot fail.
Moving Averages and Support and Resistance
Horizontal support and resistance can become more informative when they align with a meaningful moving average.
Suppose EUR/USD has horizontal support near 1.0900.
A rising 50 EMA is also approaching the same region.
A pullback into 1.0900 now contains two pieces of information:
Previous buying activity occurred around the horizontal level.
The current trend average is also near the same area.
This combination may deserve attention, although neither factor guarantees that support will hold.
Moving Averages and Market Structure
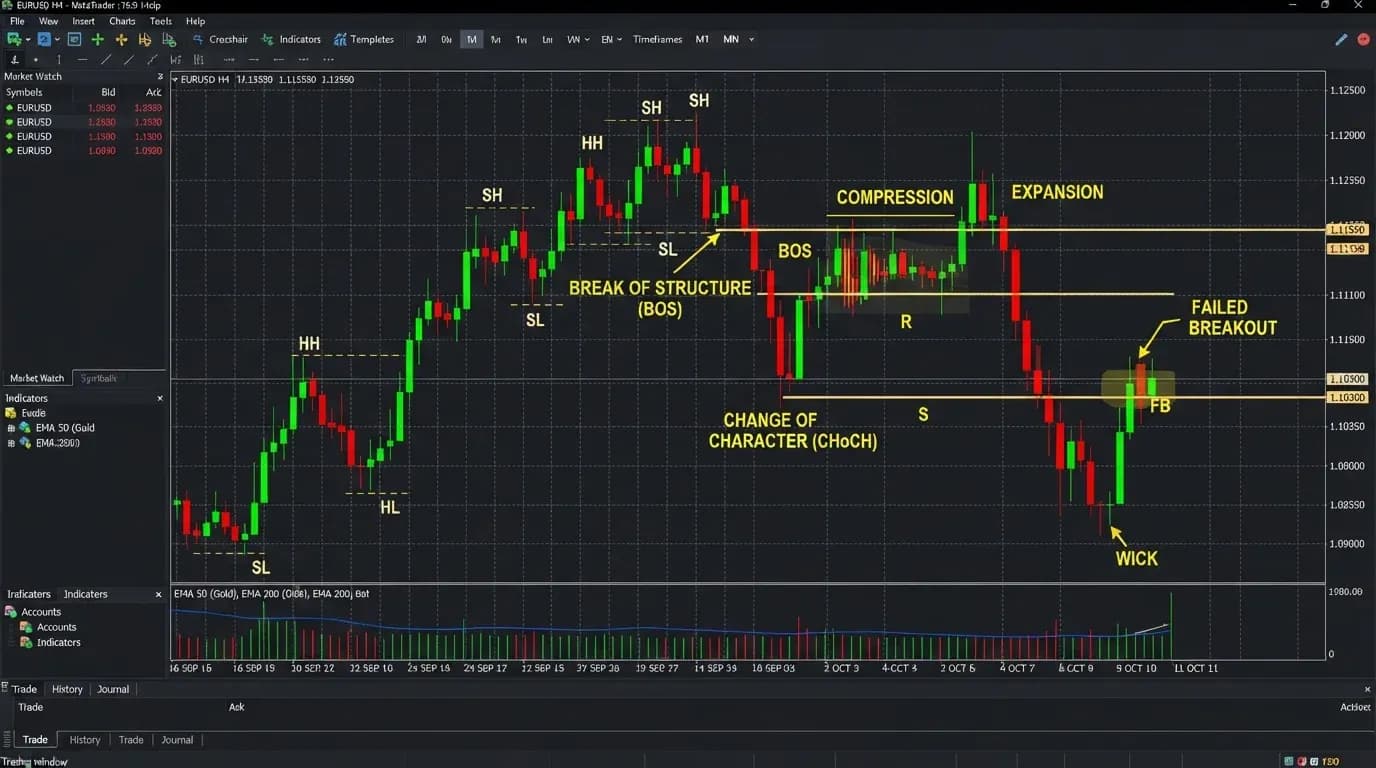
Price structure should usually take priority over an isolated moving-average signal.
Suppose a market is producing:
Higher high
Higher low
Higher high
Higher low
and remains above a rising 50 EMA.
The moving average supports what is already visible in price.
Now suppose price breaks the latest higher low, produces a lower high and begins falling.
The 50 EMA may still point upward for some time because it lags.
A trader relying entirely on the moving average could therefore recognize the change later than someone watching actual structure.
Moving Averages and Momentum
Moving averages measure trend differently from momentum indicators.
A moving average shows smoothed price direction.
Momentum tools attempt to describe the speed or strength of price movement.
Combining them can sometimes provide useful context.
For example, price may remain above a rising moving average while momentum begins weakening.
This does not automatically mean the uptrend will reverse, but it can suggest that the pace of the move is changing.
A trader can then pay closer attention to support and market structure.
Moving Average Pullback Strategy
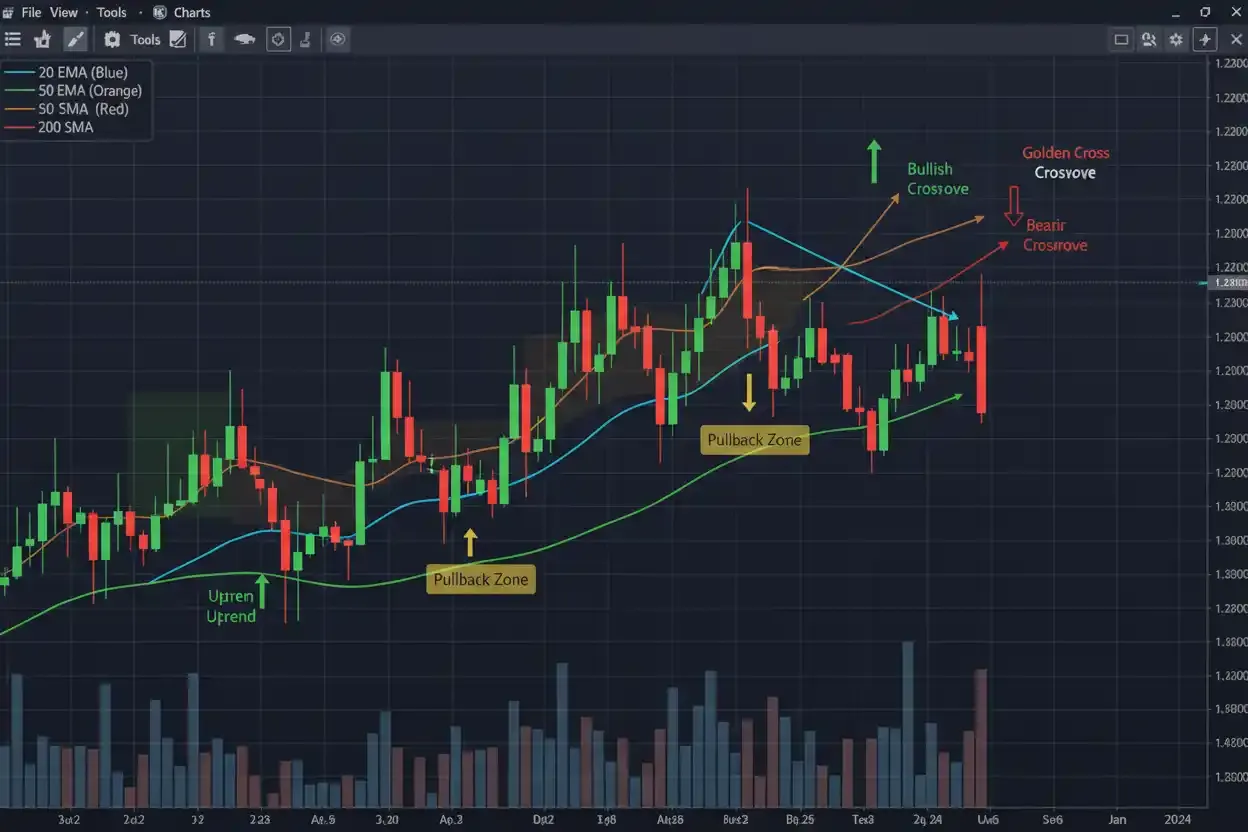
One common moving averages trading approach is to wait for a pullback within an established trend.
Suppose EUR/USD is:
- Making higher highs and higher lows
- Trading above a rising 20 EMA
- Trading above a rising 50 EMA
Instead of buying after a strong upward candle, a trader waits for price to pull back.
EUR/USD approaches the 20 EMA and a previous support area.
Buying pressure then begins to return.
The trader may consider the setup more attractive than entering after the earlier extension.
The moving average is not the reason for the trade by itself. It helps identify a pullback inside an existing trend.
Example of a Bullish Pullback
Assume EUR/USD has:
Current trend: upward
20 EMA: 1.0980
Horizontal support: 1.0970–1.0985
Current price after pullback: 1.0982
Price forms a higher low around the support area and then begins recovering.
A possible trade plan might use the market structure below the recent low as an invalidation reference.
The trader still needs to decide whether the position size is appropriate.
A technically attractive pullback does not justify excessive leverage.
Example of a Bearish Pullback
Suppose GBP/USD is trending downward.
Price is below both a declining 20 EMA and a declining 50 EMA.
A short-term recovery pushes GBP/USD toward the 20 EMA and previous resistance.
The market then forms a lower high and begins declining again.
This can fit a bearish moving-average pullback setup.
If GBP/USD instead breaks above resistance and establishes higher highs, the original downtrend interpretation weakens.
The trader should respond to that change rather than assuming the moving average must force another decline.
Moving Average Crossover Strategy
Another approach uses two averages.
Suppose a trader uses:
Fast average: 20 EMA
Slow average: 50 EMA
A bullish condition occurs when the 20 EMA moves above the 50 EMA.
A bearish condition occurs when it moves below.
A simple crossover strategy sounds attractive because the rules appear objective.
The difficulty is that crossovers perform differently under different market conditions.
Strong trends can produce useful signals.
Sideways markets can generate repeated false crosses.
Adding a market-condition filter can therefore be more important than adjusting the crossover periods endlessly.
Moving Average Trend Filter
A moving average can also be used as a filter rather than an entry signal.
For example, a trader might decide:
Consider long setups only when price is above a rising 200 SMA.
The actual entry could then depend on support, momentum or another setup.
This approach reduces the need to treat every moving-average interaction as a trade.
The average provides broad context while other information controls timing.
Trend filters can be especially useful for strategies designed to follow directional markets.
Multiple Moving Averages
Some traders use three or more averages to compare short-, medium- and long-term conditions.
For example:
20 EMA
50 EMA
200 SMA
A strongly bullish alignment might show:
Price above 20 EMA
20 EMA above 50 EMA
50 EMA above 200 SMA
All averages rising
This indicates that recent, medium-term and longer-term prices are aligned upward.
However, adding more averages also adds complexity.
If five averages all measure broadly similar information, they may create visual clutter without adding meaningful insight.
Moving Average Ribbon
A moving-average ribbon displays several averages with different periods on the same chart.
When the averages spread apart in a consistent direction, traders may interpret this as stronger trend alignment.
When they compress and cross repeatedly, the market may be losing direction.
The concept can make changing trend conditions visually obvious.
But a ribbon still uses historical price information.
Many lines do not create independent evidence if every one is derived from the same underlying prices.
Double Exponential Moving Average
A double exponential moving average indicator attempts to reduce some of the lag associated with conventional moving averages.
Despite its name, it is not simply an EMA calculated twice.
Its formula combines exponential moving-average calculations to produce a more responsive line.
Greater responsiveness can be useful when a trader wants faster trend information.
It can also create greater sensitivity to short-term fluctuations.
The corresponding double exponential moving average trading strategy should therefore be tested in the context of actual market behavior rather than assumed to be superior because the indicator reacts faster.
Weighted Moving Average
A weighted moving average assigns different importance to observations within the selected period.
Recent prices commonly receive greater weight.
This creates another method for reducing some of the lag associated with a simple average.
A weighted moving average trading strategy may respond differently from SMA- or EMA-based approaches, but the underlying principle remains the same: the indicator summarizes historical prices.
No weighting method removes uncertainty about the next price movement.
Exponential Moving Average Strategies
Because EMAs respond relatively quickly, traders frequently use them in trend-following systems.
An exponential moving average trading strategy may use price crosses, average crossovers or pullbacks toward the EMA.
For example, a trader might watch for price to remain above a rising 50 EMA and then buy only after a controlled retracement.
The logic is straightforward:
The EMA helps identify the trend.
The pullback provides a possible entry area.
Market structure determines whether the trend remains intact.
Risk management determines the financial exposure.
Each element solves a different part of the trading decision.
Simple Moving Average Strategies
A simple moving average trading strategy may use slower-moving averages to reduce sensitivity to short-term price changes.
For example, a trader following a daily market may use the 50 SMA to assess medium-term direction.
The slower average can provide cleaner visual context.
The disadvantage is slower recognition when the market changes direction.
There is no way to eliminate this trade-off completely.
Faster indicators react sooner but produce more noise.
Slower indicators reduce noise but react later.
Moving Averages and Donchian Channels
Moving averages can also be combined with price-channel tools.
A Donchian Channels strategy identifies recent highest highs and lowest lows over a defined lookback period.
A trader might use a moving average to establish trend direction and a Donchian breakout to identify an entry condition.
This creates two different types of information:
The moving average measures smoothed direction.
The channel identifies a price breakout.
That is generally more informative than using several moving averages that all measure nearly the same characteristic.
Moving Averages and Trend Confirmation
Suppose gold is making higher highs and higher lows.
It is also above a rising 50 EMA.
The 20 EMA remains above the 50 EMA.
These observations all support the bullish interpretation.
However, they are not completely independent.
Both averages are derived from the same prices producing the higher highs.
Technical analysis should recognize this overlap.
A trader may obtain more useful confirmation by combining trend structure with volatility or momentum rather than adding another similar moving average.
Moving Averages and False Signals
Moving averages can generate technical analysis false signals, particularly when the market changes direction frequently.
Consider EUR/USD trading sideways.
Price crosses above the 20 EMA.
The trader buys.
EUR/USD then falls below it.
The trader sells.
Price rises again.
Repeated entries can accumulate losses even though every moving-average signal was followed correctly.
This is why identifying market regime is critical.
A trend-following tool cannot force a range to become a trend.
Whipsaws
A whipsaw occurs when a signal is followed quickly by movement in the opposite direction.
Moving-average crossovers are particularly vulnerable.
Suppose the 20 EMA crosses above the 50 EMA.
A trader interprets this as bullish.
Two sessions later, price falls and the 20 EMA moves below the 50 EMA again.
The first signal was a whipsaw.
Such conditions often occur during consolidation or uncertain markets.
Using broader market structure can help traders recognize when crossover signals are less meaningful.
Moving Averages Lag Price
Lag is one of the defining limitations of moving averages.
A moving average can only use prices that already exist.
Suppose EUR/USD suddenly falls 150 pips.
The 200 SMA will not immediately reflect the full change because the new price is only one observation within a much larger calculation.
This can be useful when filtering temporary volatility.
It can also delay recognition of a genuine trend reversal.
The trader needs to decide whether the analytical objective favors stability or speed.
Why Faster Is Not Always Better
It may seem logical to choose the fastest possible moving average.
A very short EMA reacts quickly to price.
But it also follows nearly every small fluctuation.
That can make it difficult to separate meaningful movement from ordinary market noise.
A slower moving average filters more of this noise at the cost of additional lag.
The goal is not to find an average with zero lag.
The goal is to select a calculation suitable for the market behavior being analyzed.
Moving Averages and Forex Trading
Moving averages are widely used in forex trading.
Currency traders may use them to:
- Identify directional bias
- Follow trends
- Analyze pullbacks
- Compare multiple timeframes
- Filter trade setups
Suppose EUR/USD remains above a rising 50 EMA on the four-hour chart.
A trader may prefer long setups while that structure remains intact.
If price falls below the average but market structure still shows higher lows, the signal may be ambiguous.
If both structure and the average turn lower, the evidence for a trend change becomes stronger.
Moving Averages in Gold Trading
Gold can trend strongly, making moving averages visually useful during directional periods.
A rising 20 EMA can track an active short-term advance, while a 50 or 200-period average provides broader context.
Gold can also move sharply when interest-rate expectations, inflation data or geopolitical conditions change.
During such periods, price may move far away from a moving average before the indicator catches up.
A trader should therefore avoid assuming that price must return to an average simply because it looks "too far" away.
Moving Averages in Indices
Major indices often develop sustained trends interrupted by short-term pullbacks.
Moving averages can help distinguish a temporary retracement from broader directional change.
For a US index, a trader might monitor whether price remains above a rising medium-term average while making higher lows.
If market structure fails and the moving average turns down later, the broader trend interpretation may change.
For traders in Pakistan, active US index periods often occur later in the local day, which can influence which chart timeframe fits a practical routine.
Moving Averages in Cryptocurrency Markets
Moving averages can also be applied to supported cryptocurrency instruments.
Because crypto markets can experience strong trends and substantial volatility, moving-average separation can become pronounced.
A fast EMA may react strongly during rapid market moves.
However, large swings can also generate false crossovers and sudden breaks.
The indicator does not become more predictive simply because price volatility increases.
Risk assumptions should reflect the instrument's actual movement.
Moving Averages on MetaTrader 5
Traders can apply moving averages directly through the MetaTrader 5 platform.
Common settings include:
- Period
- Method
- Applied price
- Chart timeframe
The period determines how many observations are included.
The method determines whether the average is simple, exponential or another available calculation.
Applied price determines which price field is used, such as close.
The timeframe determines the length of each underlying chart period.
Changing any of these settings changes what the indicator represents.
Closing Price vs Other Applied Prices
Moving averages are commonly calculated from closing prices, but platforms may allow other inputs such as:
- Open
- High
- Low
- Median price
- Typical price
- Weighted price
Changing the input can alter the line.
For most beginners, closing-price calculations are easier to understand because the close is widely used in technical analysis.
More complex settings should be chosen for a clear analytical reason rather than simply because the platform offers them.
Moving Averages Across Multiple Timeframes
A trader might use a 50 EMA on several timeframes to compare market conditions.
Suppose EUR/USD is:
Above 50 EMA on daily chart
Above 50 EMA on four-hour chart
Below 50 EMA on 15-minute chart
This can describe a broader uptrend experiencing a short-term decline.
The 15-minute bearish reading does not necessarily contradict the larger charts.
It may simply reflect a temporary pullback.
This is why moving averages trading should always be interpreted within the timeframe being analyzed.
Pakistan Time and Moving Average Analysis
The moving-average formula itself does not change for traders in Pakistan, but candle timing can.
A trader in Peshawar may use a four-hour EUR/USD chart while the trading platform operates on a server timezone different from Pakistan Standard Time.
That means the opening and closing time of each four-hour candle may not correspond neatly with local four-hour blocks.
Because moving averages use those candles, different platform candle boundaries can sometimes produce slightly different indicator values.
Traders comparing screenshots or setups across platforms should keep this in mind.
Moving Averages for Traders in KPK
A trader in Peshawar, Mardan, Abbottabad, Swat, Kohat, Bannu or another part of Khyber Pakhtunkhwa can apply the same moving averages trading principles used anywhere else.
The more relevant consideration is how the chosen timeframe fits the trader's schedule.
Someone who can monitor markets only a few times during the day may find four-hour or daily moving averages more practical than a five-minute strategy requiring constant attention.
A trader following London forex activity during Pakistan's daytime may use shorter intraday averages, while someone monitoring US markets later in the day may structure the analysis differently.
The indicator should fit the trader's actual trading horizon rather than forcing the trader to remain at a screen continuously.
Internet Reliability and Short-Term Moving Average Strategies
Very short-term moving-average systems can require frequent monitoring and rapid decisions.
That can become difficult when connectivity is unreliable.
A trader should consider whether the strategy remains manageable if internet access is temporarily interrupted.
Longer timeframes generally develop more slowly and may provide more time to make decisions, although they still carry market risk.
Technical tools should fit practical circumstances as well as chart theory.
Moving Averages and Trading Confluence
Trading confluence can make moving-average signals more meaningful when genuinely different evidence agrees.
Suppose EUR/USD:
- Is above a rising 50 EMA
- Has formed a higher low
- Is sitting near established horizontal support
- Shows improving momentum
This provides several forms of information.
Contrast that with:
- 20 EMA bullish
- 30 EMA bullish
- 40 EMA bullish
- 50 EMA bullish
The second list contains several calculations of essentially the same price behavior.
Useful confluence comes from different analytical perspectives, not simply more lines.
Common Moving Average Mistakes
One mistake is assuming that every price cross generates a trade.
Another is changing the moving-average period after every losing signal.
Some traders add increasingly complex averages until historical charts look perfect.
Others ignore price structure because the indicator still points in the preferred direction.
A particularly dangerous mistake is assuming that price is guaranteed to return to a moving average after becoming extended.
Markets can remain far above or below an average for much longer than expected.
Choosing a Moving Average Period by Backward Fitting
Suppose a trader tests:
18 EMA
19 EMA
20 EMA
21 EMA
22 EMA
and finds that the 19 EMA perfectly captured several historical EUR/USD reversals.
That does not prove 19 is inherently superior.
The setting may simply fit the historical sample by chance.
A robust moving averages trading method should be based on clear logic and tested across different conditions rather than selected because it looks perfect on one chart.
Moving the Rules After a Loss
Consistency matters.
Suppose a trader's plan says the trend remains bullish while EUR/USD stays above the 50 EMA.
Price closes decisively below it.
The trader then changes the rule and says the 100 EMA is the "real" trend level.
If price falls below the 100 EMA, the 200 SMA suddenly becomes important.
This behavior avoids accepting that the original condition failed.
Technical rules are more useful when they are defined before a position rather than changed afterward.
A Moving Average Does Not Know Fair Value
A market trading well above its moving average is not necessarily overpriced.
A market far below an average is not automatically cheap.
Moving averages describe historical price relationships.
They do not calculate intrinsic or fair economic value.
During a strong trend, price can remain extended for a long time.
Buying or selling solely because the distance from an average looks unusually large can amount to trading against momentum without evidence of reversal.
Moving Averages and Risk Management
A moving-average signal says nothing about how large a position should be.
Suppose EUR/USD pulls back perfectly to a rising 50 EMA and then forms a bullish reaction.
The setup can still fail.
If the trader takes excessive leverage because the chart "looks perfect," the financial consequence of an ordinary losing trade can become unnecessarily large.
Entry analysis and position risk are different decisions.
The moving average helps organize the first.
Risk management controls the second.
A Complete Moving Average Trade Example
Suppose EUR/USD shows:
Four-hour trend: bullish
Current price: 1.1050
20 EMA: 1.1015
50 EMA: 1.0980
Previous support: 1.1000–1.1020
Price pulls back from 1.1050 to 1.1010.
The pullback enters the support zone and approaches the rising 20 EMA.
Instead of buying automatically, the trader waits.
EUR/USD stops making lower lows and recovers to 1.1025.
The trader now has several pieces of evidence:
The broader structure remains bullish.
The pullback respected previous support.
The 20 EMA remains upward.
Short-term structure has begun recovering.
A trade could still fail.
The next decision is therefore to define an invalidation level and select a position size consistent with acceptable risk.
That is a more complete use of moving averages than simply buying because price touched a colored line.
Moving Averages Trading FAQs
What is a moving average in trading?
A moving average is a technical calculation that averages market prices over a selected number of periods and updates as new data becomes available.
What does a moving average show?
It smooths price movement to make broader direction and trend behavior easier to identify.
What is an SMA?
An SMA, or simple moving average, gives equal weight to each price included in its calculation.
What is an EMA?
An EMA, or exponential moving average, gives greater weight to recent prices and therefore reacts more quickly to new market movement.
Is EMA better than SMA?
Neither is universally better. EMAs respond more quickly, while SMAs generally provide smoother and slower trend information.
What is the best moving average period?
There is no universal best period. Suitable settings depend on the timeframe, market and purpose of the analysis.
What is a 20 EMA used for?
A 20 EMA is commonly used to follow relatively short- to medium-term market direction and pullbacks.
What is a 50 moving average used for?
A 50-period average is often used as a medium-term trend reference.
What is the 200 moving average?
A 200-period moving average summarizes a much longer sequence of market prices and is widely used as a broad trend reference.
What is a moving average crossover?
A crossover occurs when one moving average moves above or below another.
What is a golden cross?
A golden cross commonly refers to the 50-period moving average crossing above the 200-period moving average.
What is a death cross?
A death cross generally refers to the 50-period moving average crossing below the 200-period moving average.
Do moving average crossovers guarantee a trend?
No. Crossovers can fail, especially when markets are moving sideways.
Why do moving averages lag?
They are calculated from historical prices, so a market must move before the average can respond.
Can a moving average act as support?
Price sometimes reacts near rising averages during uptrends, but the moving average does not guarantee that support will hold.
Can a moving average act as resistance?
Price can repeatedly react near declining averages in downtrends, but those areas can also break.
Can I use more than one moving average?
Yes. Traders often compare fast and slow averages, although too many similar averages can add redundant information.
Are moving averages useful for forex?
Yes. Forex traders frequently use moving averages to evaluate trends, pullbacks and broader currency-pair structure.
Are moving averages useful for gold?
Yes. They can help track directional gold markets, although sharp volatility can produce large deviations and false signals.
Can moving averages be used on indices?
Yes. They are commonly applied to index charts for trend and pullback analysis.
Can moving averages be used on cryptocurrency markets?
Yes. Moving averages can be applied to crypto instruments, although substantial volatility can create rapid changes and false signals.
Do moving averages work differently in Pakistan?
No. The calculations are the same. Traders in Pakistan mainly need to consider the chart timeframe, platform server time and the international market sessions they follow.
Are moving averages different for traders in KPK?
No. The indicator works the same for traders in Peshawar, Mardan, Abbottabad, Swat or elsewhere. The practical choice of timeframe may differ according to schedule and connectivity.
Which timeframe works best with moving averages?
There is no single best timeframe. The selected timeframe should match how long the trader expects to analyze or hold a position.
Why does my moving average look different on another platform?
Different chart timezones, candle construction, applied prices, price feeds or indicator settings can create differences between platforms.
Should I buy whenever price crosses above a moving average?
No. A single cross can occur during ordinary market noise, especially in sideways conditions.
Should I sell whenever price crosses below an average?
No. Price frequently crosses moving averages without developing a sustained downtrend.
Can moving averages predict reversals?
They can help reveal changes in price behavior, but they cannot predict reversals with certainty.
What should moving averages be combined with?
Price structure, support and resistance, trend context, momentum, volatility and disciplined risk management can provide useful additional context.
Can moving averages guarantee profitable trading?
No. Every moving-average method can generate losing signals, and leverage can significantly magnify losses.
Disclaimer: Moving averages can help visualize trends and changes in market direction, but every SMA, EMA, crossover and pullback signal is calculated from historical price data and can fail when market conditions change. Sideways markets, sudden volatility and unexpected events can produce false signals, while leveraged positions may amplify losses. This article provides general educational information and is not personalized investment, trading, financial, tax or legal advice. Instruments, spreads, execution conditions, margin requirements and platform features available through Medatiq may vary or change.
Trade forex, gold, and indices with Medatiq Markets
Enjoy tight spreads and fast execution, built for market condition.