Volatility Indicators: ATR, Bands, Channels & More
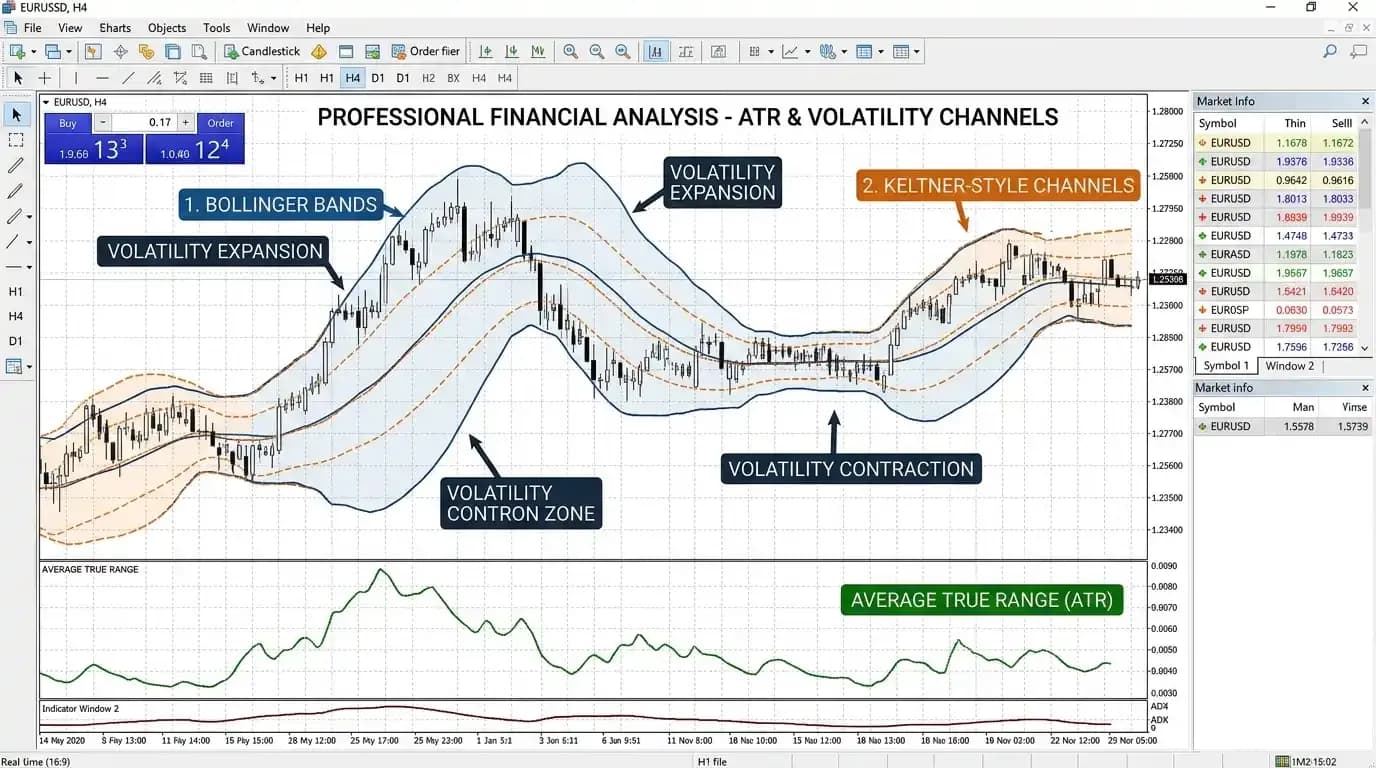
Volatility indicators help traders measure how much and how rapidly a market is moving rather than predicting whether its next move will be higher or lower. A quiet EUR/USD session can produce narrow candles and small price ranges, while an important economic release can cause the same pair to move several times its normal distance within minutes. Gold, indices and other actively traded markets can show similar shifts between calm and highly active conditions. Volatility indicators translate these changes into measurements, bands or channels that make the current trading environment easier to assess. Common examples include Average True Range, Bollinger Bands, Bollinger Band Width, Keltner-style channels, standard deviation and historical volatility. These tools can help traders judge whether stops are unusually tight, whether a market is expanding after consolidation or whether a strategy designed for quiet conditions is being applied during an unusually active period. High volatility does not automatically mean bullish conditions, and low volatility does not automatically mean a market is about to rise or fall. Volatility describes the magnitude of movement, not its direction.
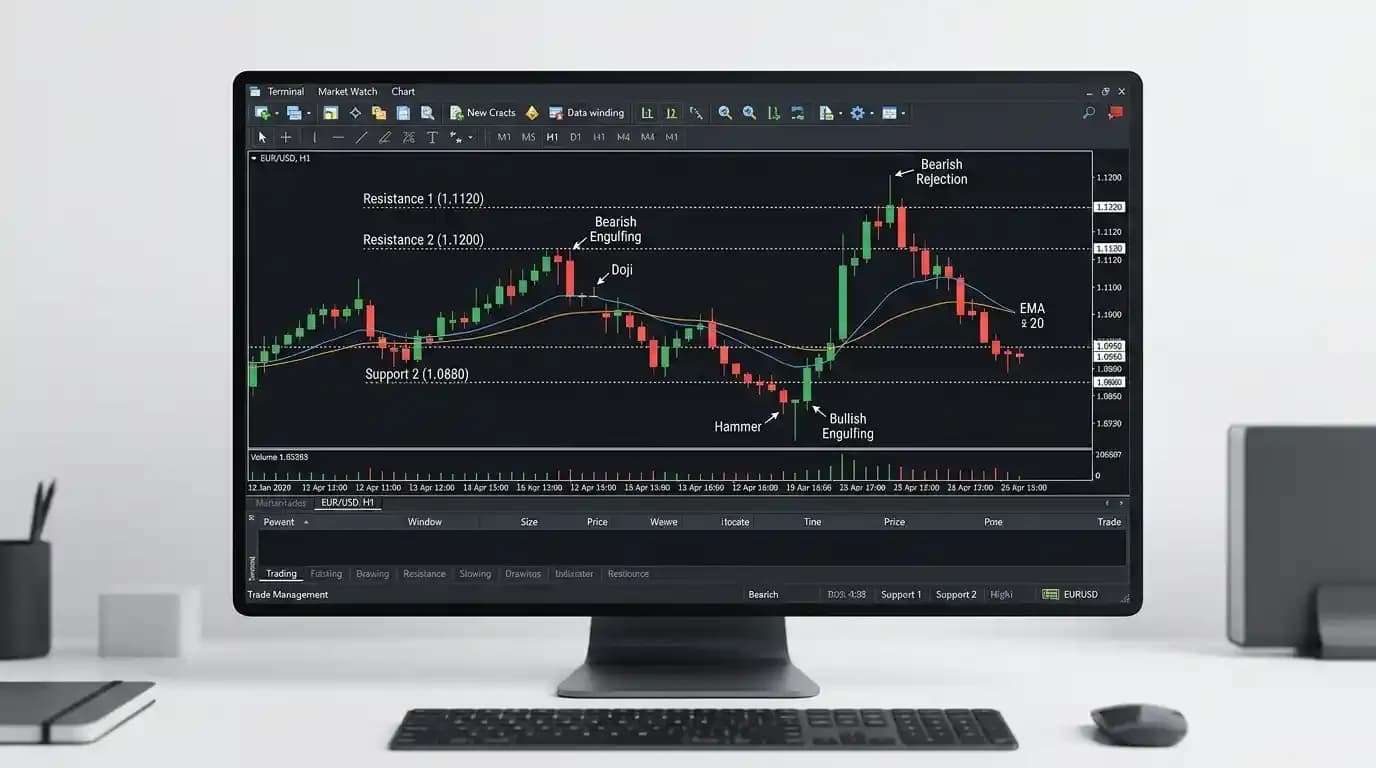
Medatiq users can examine price behavior and apply available technical tools through the MetaTrader 5 platform when analyzing supported markets.
What Is Market Volatility?
Volatility describes the degree of variation in market prices over time.
A market that changes only slightly from one period to another has relatively low volatility.
A market producing wide and rapid price swings has higher volatility.
Consider two simplified price sequences.
Market A:
100 → 100.2 → 99.9 → 100.3 → 100.1
Market B:
100 → 104 → 97 → 106 → 99
Both finish close to 100, but Market B experienced much larger movement.
Its volatility was substantially higher even though its final direction was almost unchanged.
This demonstrates why volatility and trend should not be treated as the same concept.
Volatility Is Not Direction
One of the most important principles when using volatility indicators is that they normally do not tell traders which direction to trade.
A market can be highly volatile while rising.
It can be highly volatile while falling.
It can also be highly volatile while repeatedly moving in both directions.
Similarly, low volatility can occur during a slow uptrend, slow decline or tight sideways range.
Suppose gold rises rapidly by 3% during a session. Volatility is high and direction is bullish.
Now suppose gold falls 3% during another session. Volatility may be similarly high, but direction is bearish.
A volatility measurement describes the scale of these movements rather than determining which side controls the market.
Why Volatility Matters to Traders
Volatility affects almost every practical part of a trade.
It influences how far price normally moves, how frequently levels are tested, how quickly stop-losses can be reached and how realistic a profit target may be.
It also affects position sizing.
A strategy using a fixed 10-pip stop could behave reasonably during a quiet currency session but become extremely vulnerable when the same pair routinely moves 30 or 40 pips within a short period.
Volatility can also change transaction conditions. During major economic announcements, spreads may widen and execution uncertainty can increase.
Understanding the current volatility environment therefore helps traders avoid using assumptions that belong to a completely different market condition.
Historical Volatility vs Implied Volatility
Historical volatility measures how much an instrument has actually moved over a previous period.
It is based on observed price data.
Implied volatility is different. It is derived from option prices and reflects the volatility assumptions embedded in those markets.
For ordinary chart-based trading, many common volatility indicators focus on historical price behavior.
When a trader studies ATR, Bollinger Bands or standard deviation on a chart, the calculation is based on market data that has already occurred.
This means volatility indicators are descriptive and backward-looking even when traders use them to prepare for possible future conditions.
Average True Range
Average True Range, commonly called ATR, is one of the most widely used volatility indicators.
The ATR indicator measures average price range while accounting for gaps between periods.
ATR does not tell the trader whether the market is bullish or bearish.
It tells the trader how much the market has recently been moving.
A rising ATR indicates increasing range or volatility.
A declining ATR suggests that recent price movement is becoming smaller.
This makes ATR useful for evaluating stop distances, comparing market activity and identifying changes between quiet and active conditions.
What Is True Range?
ATR begins with a calculation called True Range.
For each period, True Range considers the largest of three values:
Current high − current low
Absolute value of current high − previous close
Absolute value of current low − previous close
This approach allows the calculation to account for price gaps.
Suppose a market closes at 100.
The next period trades:
High: 105
Low: 102
The ordinary high-low range is:
105 − 102 = 3
But the market moved from the previous close of 100 to a high of 105.
The larger true-range measurement captures this gap-related movement.
How ATR Is Calculated
Once True Range is calculated for each period, ATR averages those values over a chosen lookback.
A simplified representation is:
ATR = Average of True Range values over n periods
Suppose the latest five True Range values are:
1.2
1.5
1.1
1.7
1.5
A simple average would be:
ATR = (1.2 + 1.5 + 1.1 + 1.7 + 1.5) ÷ 5
ATR = 7.0 ÷ 5
ATR = 1.4
The exact smoothing method can vary according to implementation, but the principle remains the same: ATR summarizes recent trading ranges.
How to Read ATR
ATR should be interpreted relative to the instrument itself.
An ATR of 1.5 might be enormous for one instrument and insignificant for another.
The number also depends on timeframe.
An hourly ATR measures typical hourly movement.
A daily ATR measures daily movement.
Suppose EUR/USD has a daily ATR of 0.0080.
That corresponds to approximately 80 pips of average true range under the conventional pip definition for the pair.
If daily ATR later rises toward 0.0120, recent daily movement has expanded to around 120 pips.
The increase indicates greater volatility, not a guaranteed bullish or bearish move.
ATR and Stop-Loss Distance
One practical use of ATR is to compare a planned stop with recent market movement.
Suppose EUR/USD has a one-hour ATR of 12 pips.
A trader considers using a stop only 4 pips from the entry.
The stop is considerably smaller than the recent average hourly range.
That does not automatically make it incorrect, but it shows that normal price movement could easily reach the stop.
Now suppose another setup uses a 35-pip stop.
Relative to the same ATR, the stop allows substantially more room.
The appropriate distance still depends on market structure, position size and trading method.
ATR should inform the decision rather than mechanically determine it.
ATR Does Not Define the Correct Stop
A common mistake is assuming that an ATR multiple automatically produces a good stop-loss.
For example:
Stop = 2 × ATR
This rule can create consistency, but it does not know where important support, resistance or structural invalidation exists.
Suppose a technically meaningful invalidation level is 1.5 ATR away.
Using a two-ATR stop may create unnecessary extra risk.
In another trade, an important structural level may be 2.5 ATR away.
A fixed two-ATR rule could place the stop inside normal market structure.
Volatility and price structure should therefore be considered together.
ATR and Position Size
Higher volatility often requires greater attention to position size.
Suppose a trader wants to risk $100.
Trade A requires a 20-pip stop.
Trade B requires a 50-pip stop because market volatility is higher.
If the same position size is used for both, Trade B exposes substantially more money.
A simplified relationship is:
Position size ∝ Allowed monetary risk ÷ Stop distance
As stop distance increases, position size generally needs to decrease if monetary risk is to remain constant.
This is one reason volatility awareness is closely connected to risk management.
ATR and Profit Targets
ATR can also help traders judge whether a target is realistic relative to recent movement.
Suppose EUR/USD has an hourly ATR of 8 pips.
A short-term trader targeting 80 pips within one hour is expecting movement approximately ten times the recent average hourly range.
That outcome is possible during an unusual event, but it is not consistent with ordinary recent conditions.
Conversely, targeting two pips when hourly ATR is 30 pips may create a completely different cost and execution problem.
Volatility gives targets context.
Standard Deviation
Standard deviation measures how dispersed observations are around their average.
In trading, it can be applied to price or returns to quantify variability.
A market with prices clustered closely around an average has relatively low standard deviation.
A market with wider dispersion has higher standard deviation.
In simplified terms:
Higher standard deviation = greater variability
Lower standard deviation = smaller variability
This mathematical concept is used in several technical indicators, most notably Bollinger Bands.
ATR vs Standard Deviation
ATR and standard deviation both measure aspects of volatility, but they do so differently.
ATR focuses on trading range and gaps.
Standard deviation measures dispersion around an average.
The distinction matters because two markets can have similar average ranges while exhibiting different statistical distributions of returns.
For practical chart analysis, ATR vs standard deviation represents two different ways of asking how variable recent market behavior has been.
Neither calculation automatically predicts direction.
Bollinger Bands
Bollinger Bands are among the most recognizable volatility-based chart tools.
They generally consist of:
Middle band: moving average
Upper band: moving average + volatility adjustment
Lower band: moving average − volatility adjustment
A common construction uses standard deviation to determine the distance of the outer bands from the moving average.
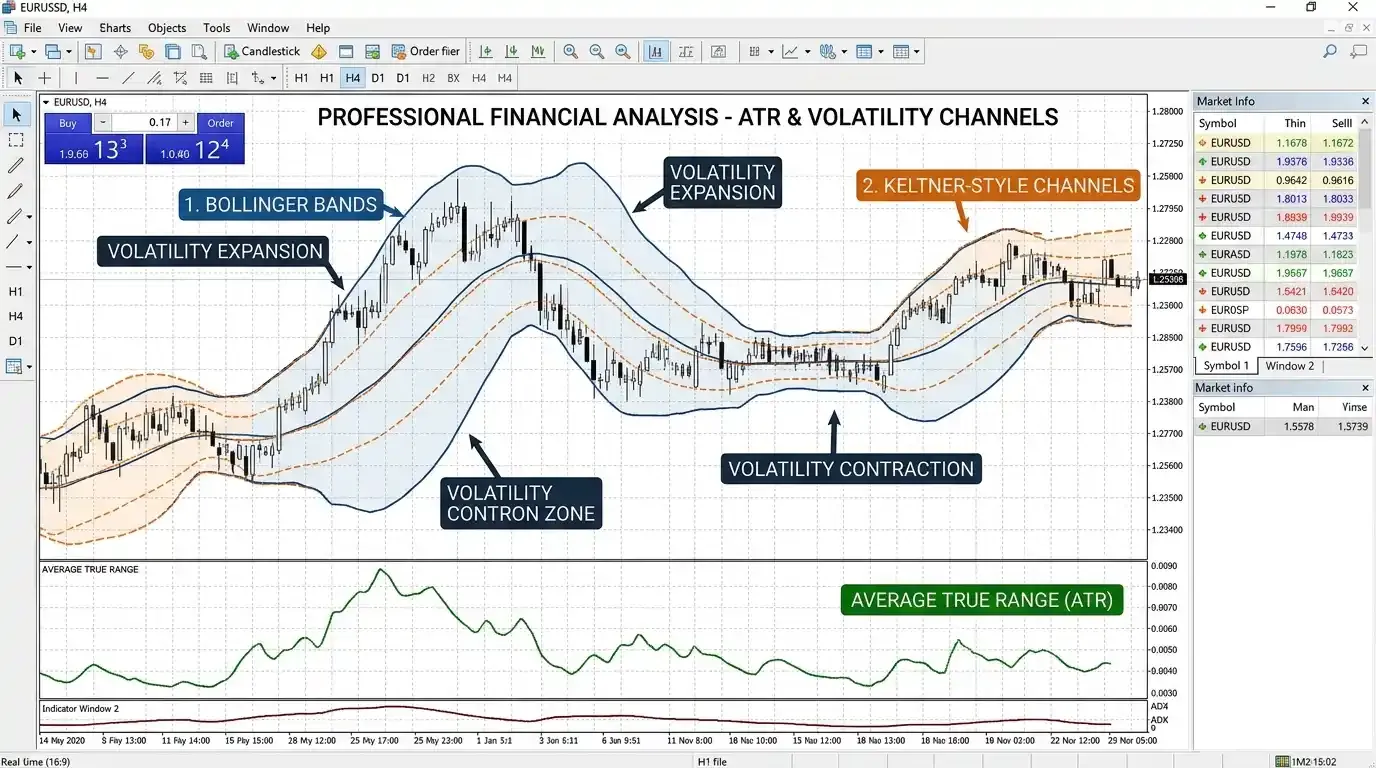
When volatility increases, the bands tend to widen.
When volatility decreases, they tend to contract.
This makes changing volatility visually easy to recognize.
Bollinger Band Formula
A simplified Bollinger Band structure is:
Middle Band = n-period moving average
Upper Band = Middle Band + (k × standard deviation)
Lower Band = Middle Band − (k × standard deviation)
where:
n = lookback period
k = standard-deviation multiplier
If market variability increases, standard deviation rises and the bands expand.
If price becomes calmer, standard deviation decreases and the bands narrow.
The bands therefore adapt to changing recent volatility rather than remaining a fixed distance from price.
What Wide Bollinger Bands Mean
Wide Bollinger Bands generally indicate that recent volatility has increased.
Suppose EUR/USD begins producing large candles after a major economic release.
Standard deviation rises.
The upper and lower bands move further apart.
This does not mean the market has become bullish.
The expansion could accompany a rally, decline or sharp two-way movement.
The useful information is simply that current price variation is greater than it was during the preceding period.
What Narrow Bollinger Bands Mean
Narrow bands indicate relatively low recent volatility.
A market may have spent hours or days trading within a tight range.
As price variation decreases, the bands contract.
Traders sometimes call extreme contraction a Bollinger Band squeeze.
Low volatility often attracts attention because periods of compression can eventually be followed by expansion.
However, narrow bands do not reveal the eventual breakout direction.
A squeeze can break upward, downward or produce a false breakout before returning to the range.
Bollinger Band Width
Bollinger Band Width converts the distance between the bands into a more direct volatility measurement.
A simplified formulation is:
Band Width = (Upper Band − Lower Band) ÷ Middle Band
The result can be expressed as a ratio or percentage.
When the bands expand, Band Width rises.
When they contract, Band Width falls.
This can make it easier to compare current volatility with earlier periods without relying only on visual inspection.
Extremely low Band Width can highlight prolonged compression, while a rapid increase can show that volatility is expanding.
Price Touching a Bollinger Band
A common misunderstanding is that touching the upper band means price is automatically overbought and should be sold.
Likewise, touching the lower band does not automatically mean a market should be bought.
During strong uptrends, price can repeatedly move along the upper band.
During strong declines, price can remain near the lower band.
The band represents a volatility-adjusted region relative to the moving average.
It is not an automatic reversal line.
Trend and market structure remain essential.
Bollinger Bands During Trends
Suppose EUR/USD is trending upward.
The middle Bollinger Band is rising.
Price repeatedly holds above it and periodically reaches the upper band.
This can indicate sustained positive directional behavior.
A trader selling every upper-band touch would repeatedly trade against the trend.
A better interpretation might be that the market is maintaining strong upward movement while volatility remains elevated.
If price later begins failing at the upper band, loses the middle band and breaks structural support, the trend picture changes.
The bands become most useful when read together with actual price behavior.
Bollinger Bands During Ranges
Bands can behave differently during sideways markets.
Suppose EUR/USD repeatedly moves between the upper and lower regions without maintaining a trend.
In this environment, outer-band interactions may coincide with range extremes.
However, traders should not assume the range will continue forever.
Eventually, price may break strongly through one side.
The same behavior that worked repeatedly during the range can fail as the market enters a new volatility regime.
Keltner-Style Channels
Keltner Channels are another volatility-based envelope commonly plotted around a moving average.
Unlike Bollinger Bands, which typically use standard deviation, Keltner Channels commonly use ATR or a related range measure to determine channel width.
A simplified structure is:
Middle line = moving average
Upper channel = middle line + ATR-based multiple
Lower channel = middle line − ATR-based multiple
This creates an adaptive channel that widens and contracts as average trading range changes.
Bollinger Bands vs Keltner Channels
Bollinger Bands vs Keltner Channels compares two indicators that measure volatility differently.
Bollinger Bands usually depend on standard deviation.
Keltner Channels commonly use ATR.
This can make their expansion and contraction behavior different even when applied to the same chart.
Bollinger Bands may respond more sharply to sudden changes in price dispersion.
Keltner Channels often appear smoother because ATR measures range differently.
Neither is inherently superior.
The useful choice depends on what aspect of volatility the trader wants to observe.
Volatility Compression
Volatility compression occurs when price movement becomes unusually narrow.
Candles shrink.
Trading ranges tighten.
ATR can decline.
Bollinger Bands contract.
Band Width falls.
This type of environment often appears before larger moves, but the compression itself does not reveal direction.
Suppose gold spends several sessions within a narrow range.
A breakout eventually occurs.
The trader still needs price evidence to determine whether buyers or sellers have taken control.
Volatility compression identifies the changing environment, not the future direction.
Volatility Expansion
Volatility expansion occurs when market movement becomes larger.
ATR rises.
Bands widen.
Candlestick ranges increase.
Breakouts can accelerate.
This can happen after prolonged consolidation or suddenly after an unexpected event.
Volatility expansion creates both opportunity and risk.
Potential price movement becomes larger, but stop-losses can also be reached faster.
Spreads and execution conditions may become less favorable during extreme activity.
Position size should therefore be reviewed rather than assuming that the same exposure used during a calm market remains appropriate.
Volatility Regimes
Markets frequently alternate between broad volatility regimes.
A simple cycle can look like:
Low volatility → expansion → high volatility → contraction → low volatility
Strategies often behave differently in each stage.
A range-trading method may perform reasonably when volatility is moderate and boundaries hold.
The same method can fail badly when volatility expands through those boundaries.
A breakout approach may struggle during prolonged compression but become more effective as directional movement develops.
Recognizing the regime is often more useful than trying to predict every individual price movement.
Chaikin Volatility
Chaikin Volatility is another indicator designed to track changes in market volatility.
It is typically based on changes in the difference between high and low prices over time.
Rather than focusing directly on direction, it helps show whether trading ranges are expanding or contracting.
A rising reading can indicate that high-low ranges are becoming larger.
A falling reading suggests contraction.
Like other volatility indicators, the interpretation should be connected to price.
An expanding range can occur during either bullish or bearish conditions.
Historical Volatility
Historical volatility measures the variability of past price returns over a selected period.
A common approach uses the standard deviation of logarithmic or percentage returns and may annualize the result.
The exact calculation can become more statistical than chart-based ATR, but the basic interpretation remains intuitive.
Higher historical volatility means recent returns have varied more widely.
Lower historical volatility means returns have been more stable.
A historical-volatility number is useful only when compared with the same instrument, similar periods or an appropriate reference.
Absolute Volatility vs Relative Volatility
Comparing raw volatility numbers across different markets can be misleading.
Suppose gold moves $30 in a session while EUR/USD moves 0.0060.
The numerical units are completely different.
Relative measures can help normalize this.
For example:
Percentage movement = Absolute movement ÷ Price × 100
If an instrument priced at 100 moves 5:
5 ÷ 100 × 100 = 5%
If another priced at 2,500 moves 25:
25 ÷ 2,500 × 100 = 1%
The second instrument has the larger absolute movement but the smaller percentage move.
This distinction matters when comparing volatility across markets.
Volatility and Trend Indicators
Volatility and trend indicators measure different characteristics.
A trend indicator attempts to describe direction or directional strength.
A volatility indicator describes how large or variable movements are.
Consider four possible environments:
Strong trend + high volatility
Strong trend + low volatility
Range + high volatility
Range + low volatility
All four can occur.
Understanding both dimensions gives a clearer picture than relying on either alone.
Volatility and Momentum
Momentum also differs from volatility.
Momentum describes directional force.
Volatility describes magnitude of variation.
Imagine an index rises steadily by 0.5% every day.
Momentum is positive and consistent, while volatility may be relatively modest.
Now imagine the same index alternates between +4% and -4%.
Volatility is extremely high, but sustained directional momentum may be weak.
Confusing these concepts can lead to poor strategy selection.
Volatility and Moving Averages
Moving averages often appear smoother during low-volatility conditions and more separated from price during rapid market movement.
Suppose EUR/USD suddenly accelerates away from its 50 EMA.
The distance can reflect both directional movement and increased volatility.
It does not mean price is required to return immediately to the average.
During high-volatility trends, markets can remain far from moving averages longer than traders expect.
A volatility measure can help explain why normal distance relationships have changed.
Volatility and Breakouts
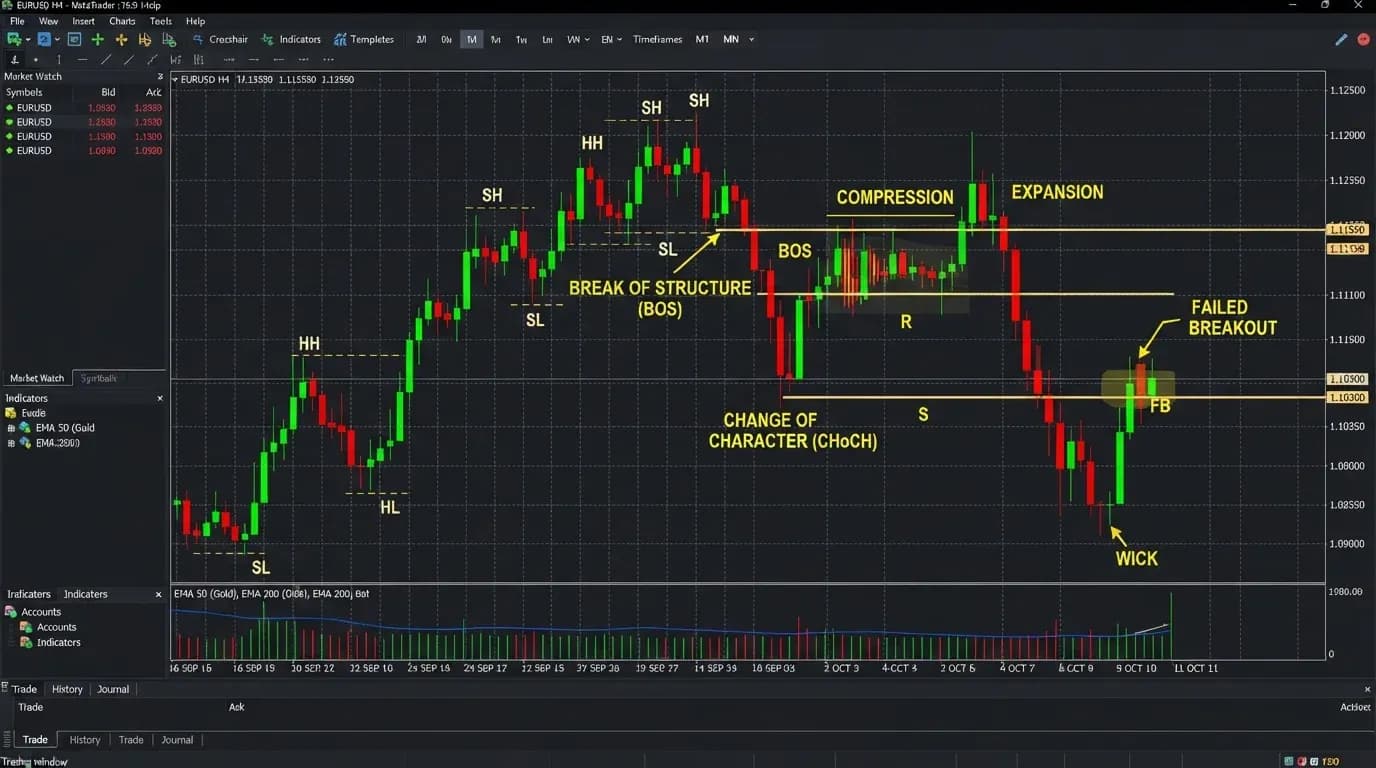
Breakouts frequently involve a transition from lower to higher volatility.
Suppose EUR/USD trades in a narrow range beneath resistance.
ATR falls.
Bollinger Bands contract.
Price eventually moves above resistance and starts producing larger candles.
ATR rises.
Bands expand.
This combination is consistent with volatility expansion following consolidation.
The breakout can still fail.
A volatility increase confirms that movement is becoming larger, not that the breakout direction is guaranteed to continue.
Volatility and False Breakouts
High volatility can produce convincing-looking false breakouts.
Price may rapidly move through resistance, trigger orders and then reverse just as quickly.
Wide candles and strong ATR readings can create the impression of certainty.
In reality, extreme activity can increase uncertainty.
This is particularly important around economic announcements.
A trader should not treat volatility expansion as proof that the first directional move is the correct one.
Volatility and Support and Resistance
Volatility affects how precisely support and resistance should be interpreted.
In a quiet market, a relatively narrow technical zone may be practical.
In a highly volatile market, normal price movement may repeatedly overshoot the same narrow level.
Suppose EUR/USD normally has an hourly range of 8 pips.
A five-pip support zone may be meaningful.
If hourly movement expands to 35 pips, expecting price to respect a five-pip boundary with the same precision may be unrealistic.
Technical zones should therefore be viewed within the current volatility environment.
Volatility and Position Sizing
Volatility should influence exposure.
Suppose two markets offer similar technical setups.
Market A has relatively low volatility and requires a 20-point stop.
Market B is much more volatile and requires a 60-point stop.
If the trader wants identical monetary risk, position size for Market B would generally need to be smaller.
Keeping the same position size while tripling the stop distance triples theoretical monetary exposure, assuming equivalent point value.
This is why volatility-adjusted risk is more useful than treating every trade identically.
Volatility-Adjusted Trading
A volatility-adjusted trading strategy changes elements of a trading plan according to current market movement.
Possible adjustments include:
- Reducing position size during high volatility
- Allowing wider structural stops when appropriate
- Using smaller targets during unusually quiet periods
- Avoiding strategies poorly suited to the current regime
- Reassessing trade frequency as market movement changes
The goal is not to avoid volatility.
It is to prevent a static trading plan from being applied blindly when market conditions have changed substantially.
Volatility and Leverage
Leverage becomes particularly important when volatility increases.
A leveraged position magnifies the financial effect of price movement relative to the margin committed.
If normal daily movement doubles while position size remains unchanged, the account can experience substantially larger fluctuations.
High volatility combined with high leverage can therefore create rapid losses.
The fact that margin requirements permit a position does not mean the position is appropriate for the current volatility environment.
Volatility and Trading Costs
Volatility can also affect practical trading costs.
During highly active or uncertain periods, spreads may widen.
Price can move between order submission and execution.
Slippage can increase.
This matters especially for strategies targeting small movements.
Suppose a trader expects a five-pip profit.
If spread and slippage consume several pips during volatile conditions, the economics of the trade can change substantially.
The total trading environment should therefore be considered alongside the chart signal.
Volatility During Economic News
Major economic announcements can create sudden volatility expansion.
Examples include:
- Inflation releases
- Employment data
- Interest-rate decisions
- Central-bank statements
- Unexpected geopolitical developments
A currency pair that was moving quietly can suddenly produce a large candle.
ATR responds afterward because the new range enters the calculation.
Bollinger Bands can widen.
Historical volatility can rise.
The indicator confirms that volatility has increased, but traders should remember that the event itself caused the change.
Indicators react to market behavior; they do not anticipate every surprise.
Forex Volatility
Volatility indicators are frequently used in forex trading.
Different currency pairs can display substantially different movement.
The same pair can also behave differently across sessions.
EUR/USD may remain relatively quiet during one period and become much more active when London and New York trading overlap.
Economic releases can produce even sharper changes.
A trader should therefore avoid assuming that a pair always has one fixed level of volatility.
Recent conditions matter.
Gold Volatility
Gold can move sharply when interest-rate expectations, inflation concerns, currency movements or geopolitical developments change.
During calm periods, ATR may decline and Bollinger Bands may contract.
A major catalyst can produce rapid expansion.
Gold traders need to understand this change because stops and position sizes suitable during a quiet period may become inappropriate when daily ranges expand substantially.
Volatility does not tell the trader whether gold should be bought or sold.
It tells the trader that the scale of movement has changed.
Index Volatility
Stock indices can experience pronounced volatility around market openings, economic data and shifts in investor sentiment.
An index may also display very different volatility during regular market activity compared with quieter periods.
For traders in Pakistan, some of the strongest US index movement often occurs later in the local day.
A trader who uses the same stop distance during a quiet period and the US market open may encounter completely different results.
Volatility indicators can help quantify that difference.
Cryptocurrency Volatility
Cryptocurrency instruments can experience particularly large price swings.
Volatility can expand rapidly and remain elevated for extended periods.
This makes tools such as ATR and historical volatility useful for understanding how current movement compares with recent conditions.
However, an indicator calculated from previous crypto volatility can still underestimate the next extreme move.
Historical measurements do not place a ceiling on future market behavior.
Volatility Indicators on MetaTrader 5
Medatiq users can analyze supported instruments on MetaTrader 5.
Depending on available platform functionality, traders can use volatility-related tools alongside standard charts and other technical indicators.
When adding a volatility indicator, verify:
- Lookback period
- Chart timeframe
- Applied price or calculation method
- Whether the indicator measures range or dispersion
- Current market session
- Whether a major event is approaching
A volatility reading has little meaning without knowing these inputs.
Timeframe and Volatility
Volatility is timeframe-dependent.
A five-minute ATR measures recent five-minute ranges.
An hourly ATR measures hourly movement.
A daily ATR summarizes daily movement.
Suppose a five-minute chart is quiet while daily volatility remains elevated.
Both readings can be correct.
The market may simply be pausing temporarily within a much larger active environment.
Traders should therefore measure volatility on the timeframe relevant to the trade rather than transferring a reading from one horizon to another.
Comparing Volatility Across Timeframes
Multiple timeframes can provide useful context.
Suppose gold shows:
Daily volatility: high
Four-hour volatility: declining
15-minute volatility: very low
This could represent short-term consolidation inside a broader high-volatility environment.
If the 15-minute range later breaks, short-term volatility may rapidly expand again.
The higher timeframe warns that the broader market still has the capacity for substantial movement.
This can be more informative than looking at one indicator on one chart in isolation.
Volatility and Pakistan Standard Time
Volatility indicators calculate the same way regardless of location, but active trading periods occur at different local times.
A trader in Pakistan following European currency markets may see volatility increase during the daytime as London activity develops.
US economic releases and index trading often become more relevant later in Pakistan Standard Time.
The exact local timing can shift when overseas markets change daylight-saving schedules.
Rather than assuming one permanent clock conversion, traders should check current session timing when their strategy depends heavily on intraday volatility.
Volatility for Traders in Khyber Pakhtunkhwa
A trader in Peshawar, Mardan, Abbottabad, Swat, Kohat, Nowshera or another part of Khyber Pakhtunkhwa sees the same underlying market volatility as other participants trading the same instrument.
The practical issue is how that volatility fits the trader's routine.
Someone who cannot monitor rapid market movement continuously may prefer broader timeframes where decisions develop more slowly.
A trader active during London forex hours may encounter a different volatility environment from someone following US indices later in the day.
The technical measurement remains global; the practical schedule is local.
Connectivity and High Volatility
Connectivity deserves more attention when markets are moving quickly.
In a calm market, a short interruption may have little immediate effect.
During a major announcement, price can move substantially within seconds.
A trading plan that depends entirely on being able to close manually at one precise moment can therefore become vulnerable if connectivity is interrupted.
Predefined risk controls can form part of the plan, though no order removes all execution risk.
The faster the market, the more important it becomes to understand what happens if manual access is temporarily unavailable.
Indicator Divergence and Volatility
Indicator divergence can appear between price and various technical measurements, but traders should be careful when applying divergence concepts to volatility tools.
A rising price with falling volatility does not automatically imply a bearish reversal.
The market may simply be trending more smoothly.
Similarly, falling price with declining ATR could indicate that downside movement is becoming less aggressive without proving that buyers are about to take control.
Volatility provides context rather than direct directional confirmation.
Hull Moving Average and Volatility
The Hull moving average indicator is designed to reduce some moving-average lag while maintaining smoothing.
Although it is fundamentally a trend-related tool rather than a volatility indicator, its behavior can look very different as volatility changes.
During calm trends, it may appear relatively smooth.
During rapid two-way markets, the line can change direction more frequently.
This reinforces a broader principle: the usefulness of many technical indicators depends heavily on the volatility regime in which they are used.
Common Volatility Indicator Mistakes
One mistake is assuming high volatility means a market should be bought because movement is strong.
Another is assuming low volatility automatically predicts a breakout.
Some traders use a fixed ATR multiple without checking market structure.
Others compare raw ATR values between completely different instruments and conclude that the larger number represents the riskier market.
A further mistake is keeping the same position size even after volatility has increased substantially.
Volatility indicators are most useful when their readings actually change trading decisions rather than being treated as decorative chart tools.
Treating Low Volatility as a Directional Signal
Low volatility tells traders that recent price movement has contracted.
It does not say whether buyers or sellers will dominate next.
Suppose Bollinger Bands become extremely narrow.
A trader may correctly expect that current compression cannot continue indefinitely.
However, buying before an upside breakout has actually occurred assumes the direction in advance.
The market could break lower.
It could also produce a false breakout and return to the range.
Volatility contraction identifies a condition, not a direction.
Treating High ATR as a Buy Signal
ATR is direction-neutral.
A sharply rising ATR can accompany:
- A powerful rally
- A severe decline
- A violent two-way market
Buying simply because ATR is rising misunderstands what the indicator measures.
The trader must determine direction separately through price structure, trend analysis or another suitable method.
ATR then provides information about the scale of movement.
Comparing ATR Across Different Instruments
Suppose EUR/USD has an ATR of 0.0080 and gold has an ATR of 35.
The raw numbers cannot be compared directly.
The instruments use different prices and units.
Even comparing two stocks with ATR values of 2 and 5 can be misleading if one trades at 20 and the other at 500.
Percentage-based or normalized measures can provide more meaningful comparisons.
Volatility should always be interpreted relative to price and instrument characteristics.
Ignoring Changing Volatility
A trading plan based on conditions from several weeks earlier may no longer fit the present market.
Suppose EUR/USD previously had a daily ATR around 50 pips.
A strategy was built around 20-pip stops.
Later, daily ATR increases to 120 pips.
The same stop is now much smaller relative to typical daily movement.
If the trader does not adapt, normal volatility may trigger exits repeatedly.
Markets change, and risk assumptions need to change with them.
Using Too Many Volatility Indicators
ATR, standard deviation, Bollinger Band Width, Chaikin Volatility and historical volatility can all provide useful information.
Using every one simultaneously may not improve the analysis.
Several may simply confirm the obvious fact that the market has become more active.
A cleaner approach is to select one or two measurements that answer specific questions.
For example:
ATR for typical range.
Bollinger Band Width for compression and expansion.
The goal is understanding, not maximizing the number of indicators on the chart.
Volatility Indicators and Risk Management
Volatility indicators become particularly valuable when connected to risk.
Suppose a trader wants to risk no more than $100.
During a quiet market, a technically appropriate stop is 20 points away.
During high volatility, the structural stop needs 50 points.
The higher-volatility trade should not automatically use the same position size.
If risk per point must decrease to preserve the $100 limit, the position needs adjustment.
This is a practical use of volatility rather than merely observing that the chart has become more active.
A Simple ATR Example
Suppose EUR/USD has a 14-period hourly ATR of:
0.0012
This corresponds to approximately:
12 pips
A trader identifies a setup requiring a 24-pip stop.
The stop distance is approximately:
24 ÷ 12 = 2 ATR
This tells the trader that the intended stop is roughly twice the recent average hourly true range.
It does not determine whether the stop is correct.
Price structure still needs to justify the location.
The ATR simply places the stop in volatility context.
A Bollinger Band Compression Example
Suppose GBP/USD trades within an increasingly narrow range.
Over several sessions:
- Candles become smaller.
- Standard deviation declines.
- Bollinger Bands contract.
- Band Width reaches a relatively low level.
Price then breaks above resistance.
The bands begin expanding as the move develops.
This is a classic transition from compression to expansion.
A trader can now assess whether the breakout is supported by trend, momentum and market structure.
The volatility signal alone does not guarantee continuation.
A High-Volatility Risk Example
Suppose gold previously had an average daily range of approximately $25.
A trader routinely used a $10 stop.
Later, market conditions change and typical daily movement expands toward $60.
The same $10 stop now occupies a much smaller fraction of normal market movement.
The trader has several choices:
Use a wider technically justified stop and reduce position size.
Use a different timeframe.
Avoid the setup.
Accept a higher chance that normal noise reaches the stop.
Volatility analysis helps make these trade-offs explicit.
A Practical Volatility Analysis Routine
Start by observing the chart.
Are candle ranges expanding or contracting?
Then check a suitable volatility indicator such as ATR.
Compare current readings with recent history rather than viewing the number in isolation.
If using bands or channels, observe whether they are widening or narrowing.
Check the market structure.
Determine whether volatility expansion is occurring within a trend, range or breakout.
Review upcoming economic events.
Finally, adjust risk assumptions if current movement differs substantially from the environment in which the original strategy was designed.
Volatility Indicator Checklist
Before acting in a changing volatility environment, consider:
What is the current ATR?
Is ATR rising or declining?
Are Bollinger Bands expanding or contracting?
Is Band Width unusually high or low relative to recent history?
Is the market trending or ranging?
Has volatility expanded after consolidation?
Is a major economic release approaching?
Does the planned stop fit current market movement?
Has position size been adjusted for the stop distance?
Are spreads or execution conditions changing?
Is the volatility measurement being interpreted on the correct timeframe?
Is the indicator being mistaken for a directional signal?
These questions can make volatility indicators practically useful rather than purely descriptive.
Volatility Indicators FAQs
What are volatility indicators?
Volatility indicators are technical tools that measure aspects of how much or how rapidly market prices are changing.
Do volatility indicators show market direction?
Usually not. They primarily measure the magnitude or variability of movement rather than whether price will rise or fall.
What is ATR?
ATR, or Average True Range, measures recent average trading range while accounting for price gaps.
Does rising ATR mean a market is bullish?
No. ATR can rise during rallies, declines or volatile two-way movement.
What does falling ATR mean?
Falling ATR generally indicates that recent price ranges are becoming smaller.
What is standard deviation in trading?
Standard deviation measures how widely price or return observations are dispersed around an average.
What are Bollinger Bands?
Bollinger Bands are volatility-adjusted bands plotted around a moving average, commonly using standard deviation to determine their width.
What does it mean when Bollinger Bands widen?
Wider bands generally indicate that recent volatility has increased.
What does it mean when Bollinger Bands narrow?
Narrower bands indicate decreasing recent volatility or price compression.
Does touching the upper Bollinger Band mean sell?
No. Strong uptrends can repeatedly reach or move along the upper band.
Does touching the lower Bollinger Band mean buy?
No. Strong downtrends can remain near the lower band for extended periods.
What is Bollinger Band Width?
Bollinger Band Width measures the relative distance between the upper and lower Bollinger Bands.
What are Keltner Channels?
Keltner Channels are volatility-adjusted envelopes commonly built around a moving average using ATR or a related range measure.
What is the difference between Bollinger Bands and Keltner Channels?
Bollinger Bands commonly use standard deviation, while Keltner Channels typically use ATR-based range measurements.
What is historical volatility?
Historical volatility measures variability in previous market returns over a selected period.
Can low volatility predict a breakout?
Low volatility can precede expansion, but it cannot determine when a breakout will occur or which direction it will take.
Can high volatility predict a reversal?
No. High volatility can occur during continuing trends as well as reversals.
Are volatility indicators useful for forex?
Yes. They can help forex traders evaluate changing ranges, stop distances and session activity.
Are volatility indicators useful for gold?
Yes. Gold volatility can change substantially around macroeconomic and geopolitical events, making range measurements useful.
Can volatility indicators be used for indices?
Yes. Index traders can use them to evaluate changing movement around market openings, economic announcements and other active periods.
Can volatility indicators be used for cryptocurrency markets?
Yes. They can help quantify crypto price variability, although historical measurements cannot define the maximum possible future move.
Which volatility indicator is best?
There is no universally best tool. ATR, standard deviation, bands and historical-volatility measures answer somewhat different questions.
Can I combine ATR and Bollinger Bands?
Yes. ATR can describe recent trading range while Bollinger Bands can show volatility relative to a moving average.
Does volatility affect position size?
It can. Wider technically appropriate stops during higher-volatility conditions may require smaller position sizes if the trader wants to maintain the same monetary risk.
Does volatility affect spreads?
Market spreads can widen during periods of extreme volatility or uncertain liquidity, depending on the instrument and trading conditions.
Do volatility indicators work differently in Pakistan?
The calculations are the same globally. Traders in Pakistan mainly need to account for when active London, New York and Asian sessions occur in Pakistan Standard Time.
Are volatility indicators different for traders in KPK?
No. A trader in Peshawar, Mardan, Abbottabad, Swat or elsewhere in KPK sees the same indicator calculations when using the same market data and settings. Local schedule and connectivity affect how rapidly changing conditions can be managed.
Which timeframe should I use for volatility indicators?
Use a timeframe relevant to the trading decision. Five-minute volatility and daily volatility measure very different market horizons.
Why is my ATR different from another chart?
Differences in timeframe, price feed, candle construction, calculation period or platform settings can produce different readings.
Can volatility indicators guarantee profitable trades?
No. They describe market variability, not future direction, and volatility can change unexpectedly.
Disclaimer: Volatility indicators such as ATR, Bollinger Bands, standard deviation and channel-based tools measure historical price variability and cannot determine future direction or set a guaranteed limit on future market movement. Volatility can expand abruptly, technical ranges can fail, and leveraged positions may produce substantial losses when exposure is too large for current conditions. This material is for general educational purposes and is not personalized investment, trading, financial, legal or tax advice. Medatiq's available instruments, spreads, execution conditions, margin requirements and platform functionality may vary or change.
Trade forex, gold, and indices with Medatiq Markets
Enjoy tight spreads and fast execution, built for market condition.