Trend Indicators: How Traders Measure Direction & Strength
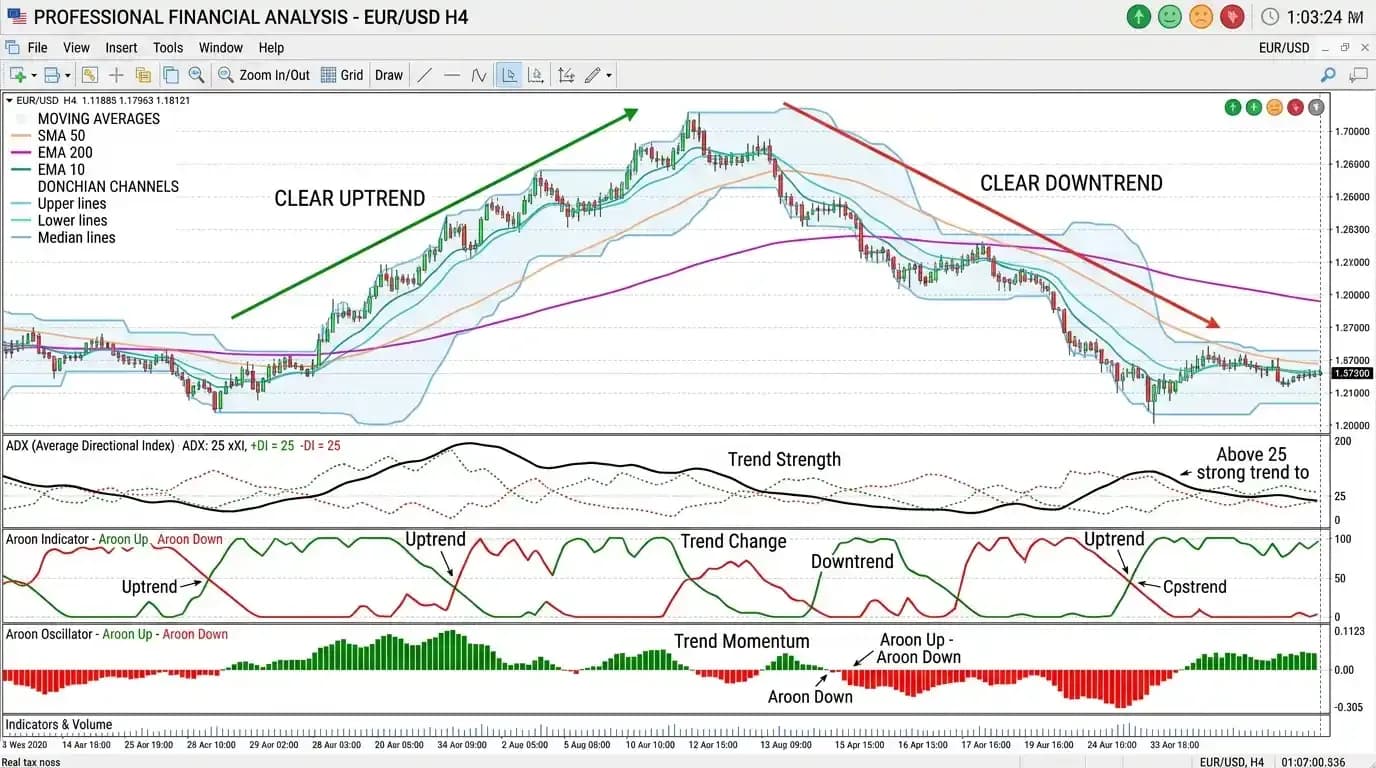
Trend indicators help traders determine whether a market is moving upward, downward or without a clear direction, and some also provide information about the strength or persistence of that movement. Instead of reacting to every individual candle, these tools organize price data so broader directional behavior becomes easier to recognize. Moving averages, ADX, Aroon, Donchian Channels and related indicators approach the problem differently: some smooth price, some measure directional strength, and others track recent highs and lows. A strong reading does not guarantee that a trend will continue, and a weak reading does not necessarily mean an immediate reversal. Trend indicators are most useful when they confirm visible market structure rather than replace it. Traders should still examine higher highs, lower lows, support and resistance, volatility and the timeframe being traded before interpreting an indicator signal.
Trend analysis works particularly well alongside momentum indicators, because direction and momentum answer related but different questions. The broader principles of technical analysis for trading provide the context needed to interpret both.
What Are Trend Indicators?
Trend indicators are technical tools designed to help identify the direction, persistence or strength of a market trend.
A market can broadly be in one of three conditions:
Uptrend
Downtrend
Sideways or ranging market
An uptrend generally produces higher highs and higher lows.
A downtrend generally produces lower highs and lower lows.
A ranging market repeatedly moves between broader boundaries without maintaining either directional sequence.
Trend indicators transform price data into lines, values or channels that make these conditions easier to observe.
They do not create the trend.
They describe price behavior that has already occurred.
Why Trend Direction Matters
Many trading methods behave differently depending on market direction.
A trend-following strategy usually seeks to participate in sustained movement rather than repeatedly trade against it.
For example, if EUR/USD is making higher highs and higher lows, a trader may prefer to look for long setups during pullbacks instead of selling every short-term rise.
If GBP/USD is consistently producing lower highs and lower lows, the trader may view temporary rallies as corrections within a broader decline.
The structure of higher highs and lower lows often provides the clearest starting point before an indicator is added.
Trend Direction and Trend Strength Are Different
A market can move upward without having a strong trend.
Consider two examples.
Market A rises steadily:
100 → 102 → 104 → 106 → 108
Market B rises less consistently:
100 → 105 → 101 → 107 → 103 → 108
Both eventually move higher.
Market A has a cleaner directional progression.
Market B contains substantial back-and-forth movement.
Some trend indicators focus mainly on direction, while others attempt to measure how strong or persistent that direction is.
This distinction matters because a trader might correctly identify an upward bias while overestimating the strength of the trend.
Price Structure Comes First
Before using trend indicators, look at the chart itself.
Suppose EUR/USD forms:
Low: 1.0800
High: 1.0900
Higher low: 1.0850
Higher high: 1.0950
Higher low: 1.0890
Higher high: 1.1010
The sequence is visibly upward.
A trend indicator can help quantify or smooth this information, but the market structure already provides the core evidence.
Now imagine EUR/USD breaks below 1.0890 and later forms a lower high.
The price structure may be changing even if a slower indicator still points upward.
Because trend indicators frequently lag, price itself can reveal a transition first.
Moving Averages as Trend Indicators
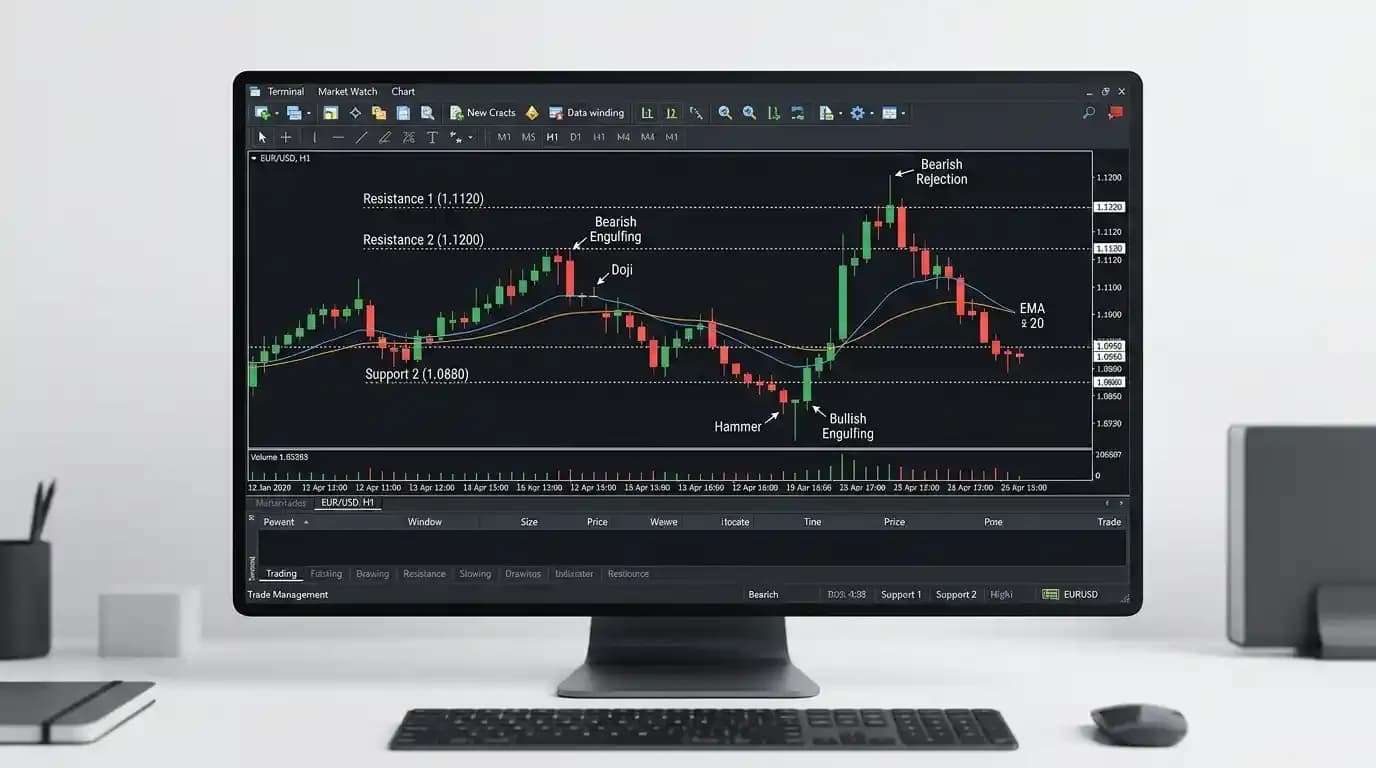
Moving averages in trading are among the simplest trend indicators.
A moving average smooths price over a selected number of periods.
If the average is rising, the prices included in its calculation are generally increasing.
If it is falling, prices are generally declining.
If it is flat, directional movement may be weak.
Traders often examine both the slope of the moving average and the location of price relative to it.
For example:
Price above rising average = bullish context
Price below declining average = bearish context
These are observations rather than automatic trade signals.
Moving Average Trend Example
Suppose GBP/USD is:
- Above the 50-period moving average
- Above the 200-period moving average
- Producing higher highs
- Producing higher lows
- Showing both averages sloping upward
Several pieces of evidence now point toward an uptrend.
If GBP/USD later falls below the 50-period average but remains above the 200-period average, the short-term trend may be weakening while the longer-term structure remains intact.
If both averages turn lower and price begins producing lower highs and lower lows, the bearish case becomes stronger.
The indicator becomes most useful when interpreted alongside actual structure.
Moving Average Alignment
Some traders compare several averages.
A bullish alignment might show:
20 EMA above 50 EMA
50 EMA above 200 SMA
Price above all three
A bearish alignment might show:
20 EMA below 50 EMA
50 EMA below 200 SMA
Price below all three
Alignment helps summarize whether short-, medium- and longer-term price calculations point in the same direction.
However, all the averages still derive from the same underlying price series.
Three moving averages agreeing with each other should not be mistaken for three completely independent forms of evidence.
ADX Indicator
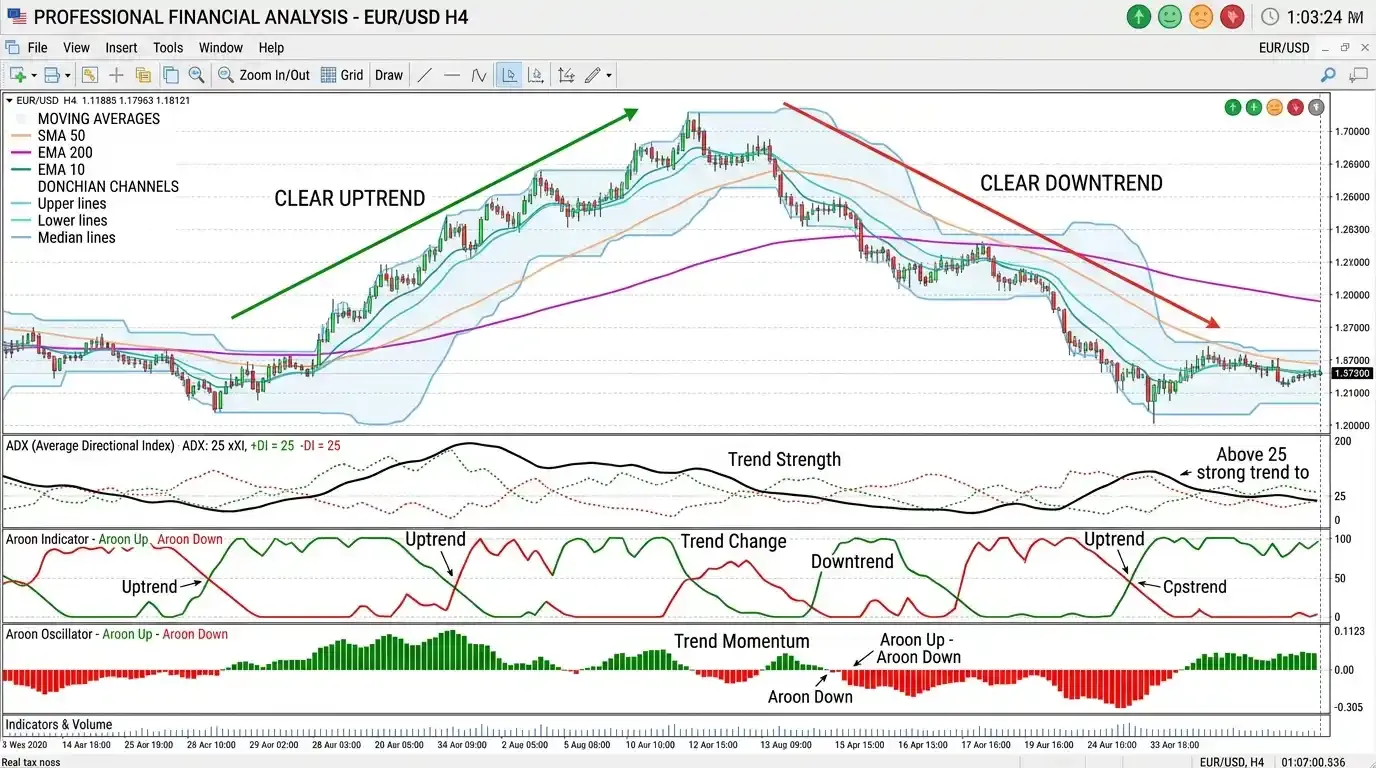
The Average Directional Index, or ADX, is designed primarily to measure trend strength rather than whether the trend is bullish or bearish.
This is an important distinction.
A high ADX can accompany a strong uptrend.
It can also accompany a strong downtrend.
The ADX indicator is commonly used with directional components often labeled +DI and -DI.
The ADX line itself focuses on the strength of directional movement.
Traders commonly interpret increasing ADX as evidence that a trend is strengthening and declining ADX as evidence that directional strength is weakening.
The exact meaning depends on the complete indicator structure and market context.
Understanding ADX Readings
ADX is commonly displayed on a scale from 0 to 100.
Traders sometimes use approximate thresholds to classify conditions, but these should not be treated as rigid laws.
A lower reading often corresponds with weak directional movement or consolidation.
A higher reading indicates stronger directional movement.
Suppose ADX rises while EUR/USD is making higher highs and higher lows.
This can support the view that the uptrend is strengthening.
Now suppose ADX rises while GBP/USD is producing lower highs and lower lows.
The reading still indicates stronger trend conditions, but this time the underlying direction is bearish.
ADX strength must therefore be interpreted alongside price direction.
ADX Is Not a Bullish or Bearish Indicator by Itself
One of the most common mistakes with ADX is assuming that a rising line means the market is bullish.
It does not.
Imagine gold falls rapidly from 2,550 to 2,450.
ADX rises sharply during the decline.
The indicator is describing stronger directional movement.
The direction is bearish because the actual market price is falling.
The same ADX rise during a major rally would describe a strong bullish trend.
Price or the directional components are needed to determine direction.
Aroon Indicator
The Aroon indicator evaluates how recently a market has produced highs and lows over a selected lookback period.
It normally contains two lines:
Aroon Up
Aroon Down
Aroon Up strengthens when recent highs occur close to the current period.
Aroon Down strengthens when recent lows occur close to the current period.
The relationship between these lines can help traders assess whether upward or downward trend behavior is dominating.
Instead of measuring how far price moved, Aroon focuses on when important highs and lows occurred.
How Aroon Identifies Trends
Suppose EUR/USD repeatedly makes new highs.
Aroon Up may remain elevated because recent highs continue appearing near the current period.
If meaningful lows occurred much earlier, Aroon Down may remain lower.
This can support an upward-trend interpretation.
During a downtrend, the reverse can occur.
Aroon Down remains strong as new lows continue appearing.
Aroon Up weakens because meaningful highs become less recent.
An Aroon indicator strategy may use line relationships, threshold areas or crossovers, but each signal should still be evaluated against market structure.
ADX vs Aroon
ADX vs Aroon compares two indicators that approach trend analysis differently.
ADX focuses primarily on directional strength.
Aroon examines the recency of highs and lows.
Suppose a market has been trending upward steadily.
Aroon may show persistent recent highs.
ADX may indicate whether the directional strength of that trend is increasing or decreasing.
They can therefore provide different information.
Using both can be more meaningful than combining several indicators that all measure almost the same characteristic.
Donchian Channels
Donchian Channels track the highest high and lowest low over a selected number of periods.
A simplified structure is:
Upper channel = highest high over n periods
Lower channel = lowest low over n periods
The channel expands and contracts as new extremes enter or leave the lookback window.
A price move above the previous upper boundary can indicate a breakout to a new period high.
A move below the lower boundary indicates a new period low.
Donchian Channels are therefore closely connected to trend-following and breakout analysis.
Donchian Channel Trend Example
Suppose EUR/USD repeatedly creates new 20-period highs.
The upper Donchian boundary rises.
If the lower boundary also gradually rises, the entire market range is shifting upward.
This can support an uptrend interpretation.
Now imagine EUR/USD trades sideways for many periods.
The upper and lower channel boundaries may flatten.
That indicates the market is no longer producing meaningful new directional extremes.
The indicator visually reflects the change from trend to consolidation.
Choppiness Index
The Choppiness Index is designed to help distinguish trending conditions from choppy or range-bound markets.
Rather than telling traders whether price is bullish or bearish, it focuses on how directional the market has been.
Higher readings generally indicate more sideways or choppy behavior.
Lower readings commonly correspond with stronger directional movement.
This can help traders decide whether a trend-following approach suits the current environment.
A Choppiness Index strategy might avoid trend entries during highly choppy conditions and become more interested as directional movement develops.
Trend Indicators and Market Regimes
Markets do not remain in the same condition indefinitely.
A common sequence is:
Range → breakout → trend → slowing trend → range
Trend indicators can help identify parts of this transition.
During the range, moving averages may flatten and cross repeatedly.
As the breakout begins, momentum can increase.
ADX may rise.
Moving averages begin separating.
Eventually, the trend matures.
ADX may stop rising.
Price begins losing structural consistency.
The averages flatten again.
Understanding this cycle is often more useful than searching for one indicator that supposedly works in every market environment.
Trend Indicators in Ranging Markets
Trend indicators commonly produce poor signals in sideways markets.
Suppose EUR/USD moves repeatedly between:
1.0950 support
1.1050 resistance
A fast moving average may cross a slower average several times.
Each crossover appears to indicate a new direction.
Yet price remains inside the same range.
Aroon lines may also alternate as short-term highs and lows appear.
Trend-following systems can suffer repeated small losses in this environment.
Recognizing range conditions can be as valuable as identifying a strong trend.
Trend Indicators During Strong Trends
Strong trends produce clearer indicator behavior.
Suppose gold moves from:
2,400 → 2,450 → 2,500 → 2,560
while maintaining higher lows.
Moving averages turn upward and separate.
Aroon Up remains strong.
ADX rises.
Several forms of analysis point in the same general direction.
Even then, the trend can reverse unexpectedly.
Strong indicators describe strong recent behavior; they do not guarantee continued buying.
The further a market moves, the more important risk management becomes.
Trend Strength Can Peak Before Price Reverses
A high trend-strength reading does not mean a market is safe to chase.
Suppose ADX reaches an unusually high reading after a large GBP/USD decline.
This may indicate that the trend has been extremely strong.
It does not tell the trader whether the next large move will continue downward or begin reversing.
Trend strength can remain elevated near the end of a move because the preceding price action was so powerful.
A trader should therefore avoid treating extreme indicator readings as guaranteed continuation signals.
Trend Indicators and Momentum Indicators
Trend and momentum tools often work well together when their roles remain distinct.
A trend indicator can answer:
What direction dominates?
A momentum indicator can answer:
Is the current movement accelerating or weakening?
Suppose EUR/USD remains above a rising 50 EMA.
The structural trend is bullish.
Momentum indicators then weaken during a pullback.
If momentum begins recovering around support while the trend remains intact, the conditions may favor continuation.
If momentum deteriorates and price also breaks structural support, the trend interpretation becomes less convincing.
Trend Indicators and Support and Resistance
Trend direction affects how traders interpret support and resistance.
Suppose a market is in an uptrend.
A pullback toward support may attract buyers who want to participate with the broader direction.
In a downtrend, resistance can become more relevant during temporary recoveries.
This does not mean traders should automatically buy support in every uptrend or sell resistance in every downtrend.
The level still needs to hold.
Trend indicators simply add directional context to the price area.
Trend Indicators and Breakouts
Breakouts can mark the beginning of new trends.
Suppose EUR/USD has been ranging beneath resistance at 1.1050.
Price finally breaks above it.
A trader then watches whether:
- Price holds above the breakout
- Moving averages begin turning upward
- ADX begins rising
- Aroon Up strengthens
- Higher lows start developing
The combined behavior can suggest that a directional move is becoming established.
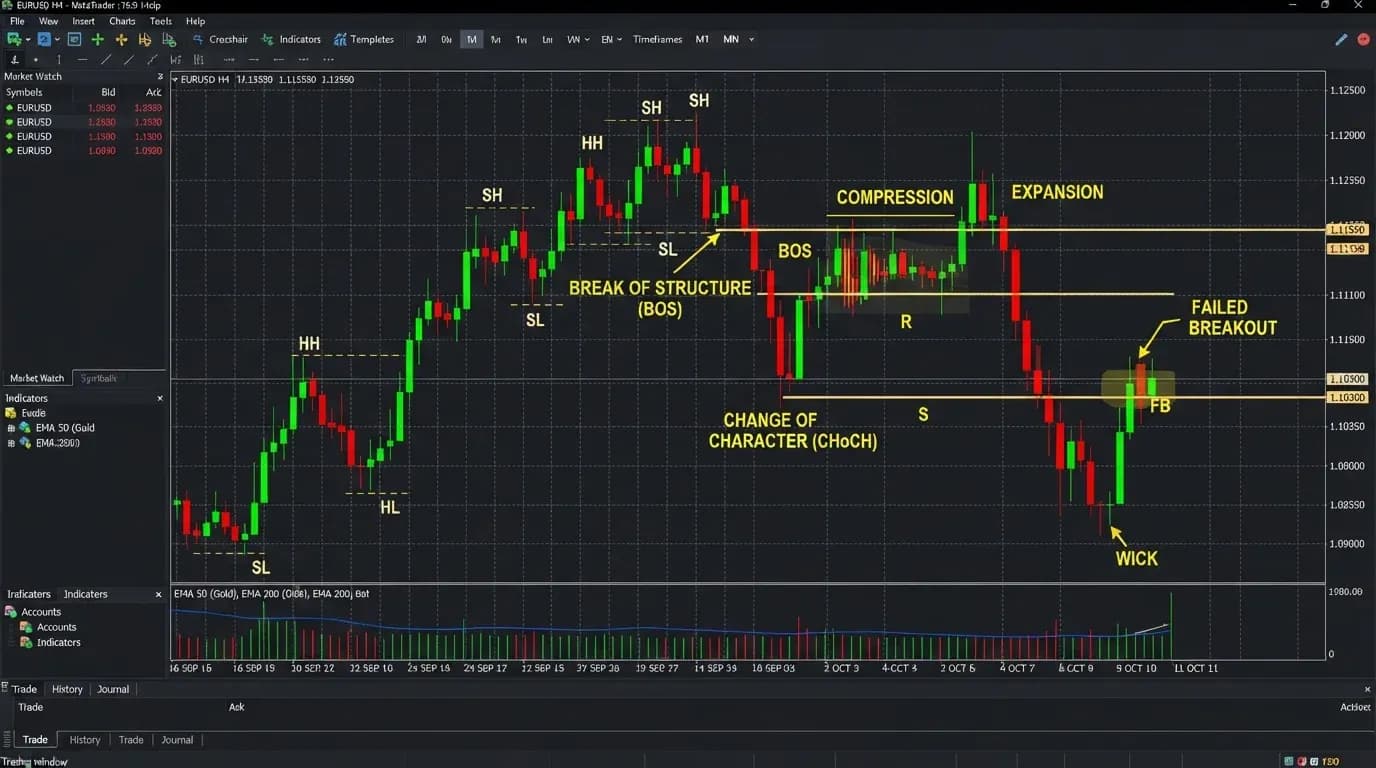
If price immediately falls back inside the range, the breakout may have failed before a trend develops.
Trend Confirmation
Confirmation means waiting for additional evidence rather than reacting to the first directional signal.
Suppose price moves above a moving average.
That alone could be ordinary market noise.
If price then produces a higher high, holds a higher low and the moving average begins rising, the bullish case becomes stronger.
If ADX also begins increasing, directional strength may be developing.
The principle is similar to trading confluence: use evidence that adds genuinely different information rather than simply collecting several nearly identical signals.
Trend Indicators and False Signals
Every trend indicator can generate false signals.
A moving-average crossover can reverse.
An Aroon crossover can occur during a range.
ADX can rise during a brief directional burst that fails.
A Donchian breakout can reverse inside the previous channel.
False signals are particularly common when volatility changes abruptly or market conditions transition from trending to sideways.
No combination of indicators removes this uncertainty completely.
Trend Indicators and Volatility
Trend and volatility are different.
A market can be volatile without trending.
Imagine an index moving:
+3%
-3%
+4%
-4%
The market is highly volatile but may end close to where it started.
A smoother trend might move:
+0.5%
+0.4%
+0.6%
+0.5%
with far less volatility but clearer direction.
Dedicated volatility indicators can help traders separate the size of price movement from directional persistence.
This distinction matters when setting stops and selecting strategies.
Moving Average Strategy vs Trend Indicator Strategy
A moving-average approach may focus on price location, slope or crossovers.
An ADX approach might wait for directional strength to exceed a chosen threshold.
An Aroon method might look for recent highs or lows dominating the lookback period.
A Donchian method might trade new period extremes.
All are forms of trend analysis, but they do not identify trends in exactly the same way.
The best choice depends on what the trader wants the indicator to measure.
Weighted Moving Averages
A weighted moving average trading strategy gives more importance to selected prices, commonly the most recent observations.
This makes the indicator react faster than a simple moving average using the same number of periods.
Greater responsiveness can help identify changing conditions sooner.
It can also produce more frequent direction changes during noisy markets.
The trade-off between responsiveness and stability appears throughout trend analysis.
Trend Indicators and Multiple Timeframes
A market can trend differently on different timeframes.
Suppose EUR/USD shows:
Daily chart: strong uptrend
Four-hour chart: sideways consolidation
15-minute chart: short-term downtrend
All three observations can be correct simultaneously.
The 15-minute decline may be a pullback within the daily trend.
The four-hour range may represent consolidation before the next larger move.
Trend indicators must therefore be interpreted according to the timeframe on which they are calculated.
A bullish daily moving average cannot be used as proof that every five-minute movement should also be bullish.
Higher-Timeframe Trend
Higher timeframes generally provide broader directional context.
A trader might use the daily chart to establish trend and the one-hour chart to identify entries.
Suppose the daily market is above a rising 200 SMA.
The trader may prefer long setups.
On the hourly chart, price pulls back toward support.
If short-term trend indicators begin turning upward again, the trader may see alignment between the broad trend and the entry timeframe.
This is one common way to combine multiple time horizons.
Trend Indicators in Forex Trading
Trend indicators are widely used in forex trading.
Currency pairs can develop sustained directional moves when interest-rate expectations, economic data or central-bank policy changes.
A trader following EUR/USD might use:
- Market structure for direction
- A moving average for trend context
- ADX for directional strength
- Support and resistance for location
Suppose the pair is above a rising moving average and making higher highs while ADX increases.
The trend appears strong.
If EUR/USD later breaks a major higher low and ADX begins declining, the conditions may be changing.
Trend Indicators for Gold
Gold can form powerful trends when macroeconomic expectations shift.
During a sustained advance, price may remain above rising moving averages for long periods.
ADX can indicate increasing directional strength.
Donchian Channels may record repeated new highs.
However, gold can reverse sharply during unexpected policy or geopolitical developments.
Trend indicators react to the reversal only after price has begun moving.
This lag should always be considered before taking large leveraged positions simply because several trend tools remain bullish.
Trend Indicators for Indices
Equity indices can form persistent trends, particularly when broader economic expectations and investor sentiment align.
Traders may use longer moving averages to identify broad direction and faster indicators to monitor shorter-term changes.
US indices can also experience substantial volatility around market openings and economic releases.
For traders in Pakistan, this activity often occurs later in the local day, so the timeframe selected for trend analysis should fit the hours during which the market can realistically be monitored.
Trend Indicators for Cryptocurrency Markets
Trend indicators can also be applied to supported cryptocurrency instruments.
Crypto markets can produce strong directional moves in relatively short periods.
Aroon may show repeated new highs or lows.
ADX can rise sharply.
Moving averages can separate considerably.
These conditions can make trends visually obvious, but cryptocurrency volatility can also produce sudden reversals.
The strength of yesterday's trend does not limit the size of tomorrow's move in the opposite direction.
Trend Indicators on MetaTrader 5
Medatiq users can apply technical indicators through the MetaTrader 5 platform on supported instruments.
A trader can combine price charts with moving averages and other available tools.
Before interpreting a trend indicator, check:
- Calculation period
- Timeframe
- Applied price
- Indicator-specific settings
- Current market structure
Changing the period can substantially alter the signal.
A 10-period trend indicator responds much faster than a 100-period version.
Neither setting is meaningful without knowing the trading horizon.
Choosing Trend Indicator Settings
Shorter indicator settings react quickly to changes in price.
Longer settings provide smoother information.
Suppose an Aroon or moving-average calculation uses a short lookback.
It may recognize a directional shift early.
It may also change direction frequently during normal volatility.
A longer period filters more of these fluctuations but reacts later.
This is the same fundamental trade-off traders encounter with most technical indicators:
Faster response = more sensitivity
Slower response = more smoothing
The goal is not to find one perfect parameter.
It is to use a setting appropriate for the type of movement being analyzed.
Avoid Changing Settings After Every Loss
A common mistake is constantly modifying indicator parameters after unsuccessful trades.
A trader uses a 20-period setting.
A false signal occurs.
The trader changes it to 25.
Another loss occurs.
The setting becomes 31.
Eventually, historical charts may look perfect simply because the parameters were fitted to known outcomes.
This does not mean the settings will work on future data.
A useful indicator method needs clear reasoning and should be evaluated across different market conditions.
Trend Indicators and Overfitting
Overfitting occurs when a strategy becomes too closely tailored to past price behavior.
Suppose a trader tests hundreds of combinations of ADX thresholds, moving-average lengths and Aroon periods until one produces exceptional historical results.
The combination may simply reflect chance relationships in the chosen sample.
Future markets may behave differently.
Simple, logically understandable rules are often easier to evaluate than highly optimized systems whose apparent precision exists only in historical data.
Choppiness and Whipsaws
Trend traders often struggle most during choppy conditions.
Imagine EUR/USD crosses above and below a 50 EMA repeatedly.
Aroon lines alternate.
ADX remains weak.
Price continues moving sideways.
Entering every directional signal can produce a series of small losses.
The market is effectively telling the trader that no sustained trend is present.
Recognizing these periods can help avoid forcing a trend strategy into an unsuitable environment.
Late Entries
Trend indicators can make a market look most convincing after a large move has already occurred.
Price is far above its moving average.
ADX is extremely high.
Aroon Up remains elevated.
Everything appears bullish.
A trader then enters because the trend looks obvious.
Soon afterward, the market pulls back.
This is a common risk with lagging confirmation.
A strong trend signal does not necessarily mean the current price offers an attractive entry.
Direction and entry location are separate questions.
Trading Against a Strong Trend
Another common mistake is automatically trying to call the top or bottom because a trend has already moved a long distance.
A trader may assume EUR/USD has "gone too far" above a moving average and short it.
Price continues higher.
Distance from an indicator is not proof of reversal.
A trend can remain extended longer than expected.
Countertrend positions generally need evidence that actual price structure is changing, not merely that the existing trend feels old.
Trend Indicators and Trading Orders
Once a trend is identified, the trader still needs an entry method.
A market order may be used when immediate participation fits the setup.
A limit order can allow the trader to wait for a pullback.
Suppose EUR/USD is trending upward but appears temporarily extended.
Instead of buying at the current price, a trader may wait for a retracement toward support.
The trend indicator provides directional context.
The order type controls how the entry is attempted.
Neither determines appropriate position size.
Trend Indicators and Risk Management
No trend indicator determines how much capital should be exposed.
Suppose ADX indicates a strong trend, moving averages are aligned and price structure appears clean.
The trade can still fail.
A sudden economic announcement can reverse the market.
A breakout can turn into a false breakout.
Liquidity can change.
If leverage is excessive, an ordinary failed trend signal can produce an unnecessarily large loss.
Trend quality and financial risk should always be treated as separate decisions.
A Simple Trend Indicator Example
Suppose EUR/USD displays:
Price: 1.1050
50 EMA: 1.0990 and rising
200 SMA: 1.0900 and rising
Structure: higher highs and higher lows
ADX: increasing
The evidence broadly supports an uptrend.
A trader does not necessarily need to buy immediately.
Price may already be extended.
The trader could wait for a pullback toward support.
Suppose EUR/USD retraces to 1.1000 and stabilizes.
If a higher low forms and momentum begins improving, the entry may offer a more structured location.
If price instead breaks decisively below the previous higher low, the trend interpretation needs to be reconsidered.
Example of a Weakening Trend
Suppose GBP/USD has been falling for several sessions.
Initially:
Price below falling 50 EMA
ADX rising
Aroon Down elevated
Lower highs and lower lows
Later:
ADX begins declining
Price stops making new lows
Aroon Down weakens
GBP/USD breaks above the latest lower high
No single event proves a reversal.
Together, however, the evidence suggests that the previous downtrend is losing strength.
The trader can then wait to see whether a new bullish structure develops.
Trend Indicators and Pakistan Market Hours
Trend indicators use the same calculations regardless of where the trader is located, but timeframe and session context matter.
A trader in Pakistan following EUR/USD may see European-session trends develop during the daytime, while important US activity often occurs later in Pakistan Standard Time.
An indicator calculated on a 15-minute chart during a quiet session can behave differently from the same indicator during active London–New York trading.
The formula does not change.
The market environment does.
Trend Trading in Khyber Pakhtunkhwa
For traders in Peshawar, Mardan, Abbottabad, Swat, Kohat, Bannu, Dera Ismail Khan, Nowshera, Charsadda, Mansehra, Haripur, Swabi, Dir or Chitral, the most practical trend timeframe depends on how frequently the market can be monitored.
Someone who can check charts only periodically may find four-hour or daily trend indicators more manageable.
A trader following the London forex session during Pakistan's daytime may work with shorter timeframes.
Someone interested in US markets may be more active later in the local day.
The indicator should fit the trader's schedule rather than forcing continuous monitoring that is unrealistic.
Platform Time and Trend Indicators
MetaTrader charts may use a server timezone different from Pakistan Standard Time.
This can affect when candles begin and end.
Because trend indicators calculate values from those candles, two platforms can sometimes show slightly different indicator readings despite displaying broadly similar market prices.
The effect is especially noticeable on intraday charts.
A trader comparing indicator values from different sources should confirm the timeframe, period, applied price and chart timezone before assuming one calculation is wrong.
Connectivity and Short-Term Trend Trading
Short-term trend strategies can require frequent monitoring.
If a trader relies on very small timeframe signals, interruptions in connectivity can make position management more difficult.
This is particularly relevant anywhere internet reliability varies.
A higher-timeframe trend setup develops more slowly and may provide additional time to respond.
That does not make it safer automatically, but it may fit the trader's practical circumstances better.
A sound method should work with real-life constraints rather than only on an ideal chart.
A Practical Trend Analysis Routine
Begin with price structure.
Identify whether meaningful highs and lows are rising, falling or remaining within a range.
Then examine a suitable moving average or another trend tool.
Check whether its direction agrees with price.
If using ADX, assess whether directional strength appears to be increasing or declining.
If using Aroon, observe whether recent highs or lows dominate.
Then identify important support and resistance.
Consider momentum and volatility.
Finally, define what price behavior would prove the trend interpretation wrong.
The indicator should organize the analysis, not dominate it.
Trend Indicator Checklist
Before relying on a trend signal, ask:
What is the actual price structure?
Is the market making higher highs or lower lows?
Is the market trending or ranging?
Which timeframe is being analyzed?
What does the moving-average slope show?
Is trend strength increasing or weakening?
Does Aroon confirm recent directional extremes?
Is ADX being used for strength rather than mistaken for direction?
Is price close to major support or resistance?
Is momentum confirming the move?
Is volatility unusually high?
Is a major economic event approaching?
Would the entry be chasing an already extended trend?
Where would the trend interpretation become invalid?
How much capital would be at risk?
These questions help keep trend indicators connected to actual market behavior.
Trend Indicators FAQs
What are trend indicators?
Trend indicators are technical tools used to help identify the direction, persistence or strength of market movement.
What are the main market trends?
Markets are commonly described as uptrending, downtrending or moving sideways.
What does an uptrend look like?
An uptrend generally forms higher highs and higher lows.
What does a downtrend look like?
A downtrend generally produces lower highs and lower lows.
What is a sideways market?
A sideways or ranging market moves without maintaining a clear sequence of rising or falling highs and lows.
Are moving averages trend indicators?
Yes. Moving averages are widely used to smooth price and help identify broader direction.
What does ADX measure?
ADX primarily measures the strength of directional movement rather than whether the trend itself is bullish or bearish.
Does a high ADX mean price will rise?
No. A high ADX can occur during either a strong uptrend or a strong downtrend.
What is the Aroon indicator?
Aroon measures how recently significant highs and lows occurred within a selected lookback period.
What are Donchian Channels?
Donchian Channels track the highest high and lowest low over a selected number of periods and are commonly used in breakout and trend analysis.
What does the Choppiness Index measure?
The Choppiness Index helps describe whether a market is behaving more directionally or more like a range.
Which trend indicator is best?
There is no universally best trend indicator. Moving averages, ADX, Aroon and channel-based tools answer somewhat different questions.
Can I combine trend indicators?
Yes, but combining indicators that measure genuinely different characteristics is generally more informative than stacking several similar tools.
Can trend indicators predict reversals?
They may help identify changing conditions, but they cannot predict reversals with certainty.
Why do trend indicators lag?
Most trend indicators use historical price data, so price must move before their calculations can respond.
Are lagging indicators bad?
Not necessarily. Lag can filter short-term noise, although it also means signals may appear after part of a move has already occurred.
What is a trend crossover?
A crossover commonly refers to one moving average moving above or below another, indicating a change in the relationship between shorter- and longer-term prices.
Can moving-average crossovers fail?
Yes. Crossovers frequently produce false signals during sideways markets.
Are trend indicators useful for forex?
Yes. Forex traders commonly use trend tools to assess directional movement in currency pairs.
Can trend indicators be used for gold?
Yes. Gold can develop strong directional trends that are visible through moving averages, ADX, channels and other tools.
Can trend indicators be used for indices?
Yes. They can be applied to supported index markets on multiple timeframes.
Can trend indicators be used for cryptocurrency markets?
Yes. Trend indicators can be used on crypto price data, although rapid volatility can produce sudden signal changes.
Do trend indicators work differently in Pakistan?
No. The calculations are the same. Traders in Pakistan mainly need to consider session timing, chart timezone and the timeframes they can realistically monitor.
Are trend indicators different for KPK traders?
No. A trader in Peshawar, Mardan, Abbottabad, Swat or another KPK city sees the same indicator calculations for the same data. Local schedule and connectivity may influence how the signals are practically used.
Which timeframe is best for trend indicators?
There is no single best timeframe. The appropriate choice depends on the intended trading horizon and how frequently the market can be monitored.
Can a market have different trends on different timeframes?
Yes. A market can be bullish on a daily chart while temporarily bearish on an intraday chart.
What is the biggest mistake with trend indicators?
One common mistake is treating an indicator as a prediction rather than a lagging description of market behavior.
Can trend indicators guarantee profitable trades?
No. Every trend can weaken or reverse, indicators can generate false signals, and leverage can magnify losses when market movement differs from the trader's expectation.
Disclaimer: Trend indicators can help describe market direction and directional strength, but moving averages, ADX, Aroon, channels and similar tools are derived from historical market data and cannot guarantee that an existing trend will continue. Trends can reverse abruptly, range-bound conditions can generate false signals, and leveraged positions may increase losses substantially when price moves against a trade. This material is general educational information, not individualized investment, trading, financial, legal or tax advice. Medatiq's supported instruments, spreads, execution conditions, margin requirements and platform features may vary or change.
Trade forex, gold, and indices with Medatiq Markets
Enjoy tight spreads and fast execution, built for market condition.