Support and Resistance Explained for Traders
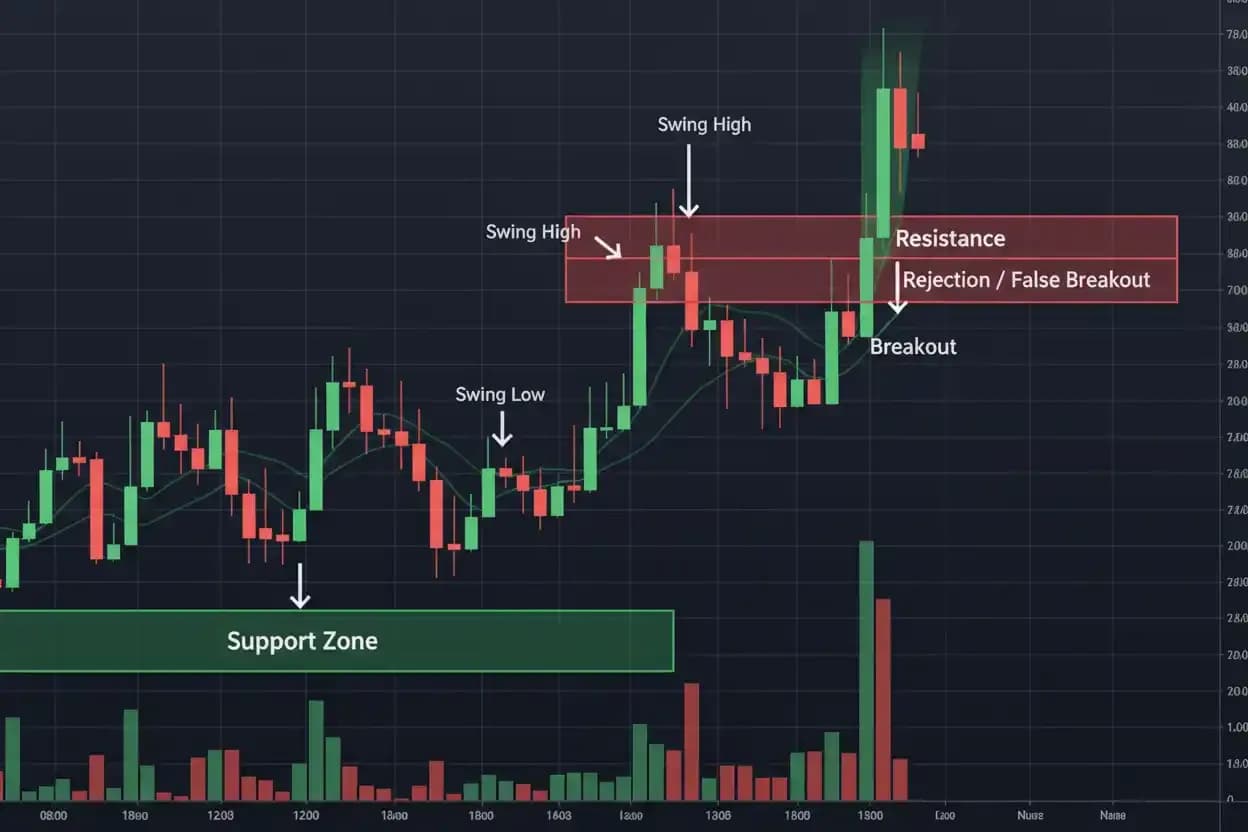
Support and resistance are price areas where a market has previously shown a noticeable change in buying or selling pressure. Support develops where falling prices begin attracting enough demand to slow, pause or reverse a decline, while resistance develops where rising prices encounter enough selling pressure to limit further gains. Traders use these areas to understand market structure, identify possible entry and exit zones, judge whether a trend is continuing and recognize when a breakout may be occurring. Support and resistance are rarely perfect single-price barriers; they are usually more useful when treated as zones because markets often move slightly beyond a previous high or low before deciding whether to continue or reverse. A level that worked several times can eventually fail, and a breakout that initially looks convincing can quickly reverse. For that reason, support and resistance should be combined with price structure, timeframe context, momentum and sensible risk management rather than treated as automatic buy and sell signals.
Support and resistance form one of the foundations of technical analysis for trading, and the same concepts can be applied to forex, gold, indices and other markets available through Medatiq.
What Are Support and Resistance?
Support is an area below the current market price where buying interest has previously been strong enough to interrupt a decline.
Resistance is an area above the current price where selling pressure has previously been strong enough to interrupt a rise.
Imagine EUR/USD falls several times toward 1.0800 and rebounds on each attempt.
A trader may begin treating the area around 1.0800 as support.
Now imagine EUR/USD repeatedly approaches 1.1000 but struggles to move higher.
The area around 1.1000 may be considered resistance.
The important word is area.
Markets do not always reverse at exactly the same decimal price. One test may reach 1.0798, another 1.0803 and another 1.0795.
Taken together, these reactions may form a support zone rather than an exact line.
Why Support Forms
Support develops when buying pressure becomes strong enough to absorb available selling.
Suppose GBP/USD falls from 1.2900 toward 1.2700.
At 1.2700, several things may happen.
Traders who were waiting for a lower entry may begin buying.
Short sellers may close profitable positions, which also creates buying activity.
Other participants may view the price as attractive relative to recent trading.
If this demand becomes strong enough, the decline can slow or reverse.
That reaction becomes visible on the chart.
If GBP/USD later returns to the same area and buyers appear again, traders may give the level more attention.
Why Resistance Forms
Resistance represents the opposite situation.
Suppose gold rises repeatedly toward 2,500 but struggles to trade sustainably above that region.
Some traders may take profits near 2,500.
Others may initiate short positions.
Additional sellers may simply regard the price as expensive relative to recent movement.
If selling pressure overwhelms buying demand, gold may pull back.
Repeated reactions around the same area can make the resistance zone increasingly visible to market participants.
However, visibility does not make the level permanent.
If buying pressure eventually becomes strong enough, resistance can break.
Support and Resistance Are Zones, Not Perfect Lines
Beginners often draw one thin horizontal line and expect the market to react at exactly that number.
Real price behavior is rarely that precise.
Suppose support appears around 1.0950.
Previous reactions occurred at:
1.0946
1.0952
1.0948
Drawing a zone around these prices often describes the market more accurately than insisting that 1.0950 itself is the only valid level.
The width of the zone depends on the instrument and timeframe.
A five-pip range may be meaningful on EUR/USD but far too narrow for a highly volatile gold market.
Support and resistance should therefore be interpreted relative to normal market movement.
How to Identify Support
One straightforward way to identify support is to look for previous swing lows.
A swing low forms when price declines, reaches a local bottom and then begins rising.
If several meaningful lows develop around the same region, that area may deserve attention.
For example:
First low: 1.0810
Second low: 1.0805
Third low: 1.0814
A trader might describe 1.0800–1.0815 as a broader support region.
The exact boundaries depend on chart context.
Support becomes more meaningful when the reaction from the area is substantial rather than merely a tiny pause.
How to Identify Resistance
Resistance can be identified through previous swing highs.
Suppose EUR/USD produces the following highs:
1.1045
1.1052
1.1048
The region around 1.1045–1.1052 may represent resistance.
A trader can then observe what happens on the next approach.
Does price reject the area?
Does momentum weaken?
Does the market consolidate below resistance?
Or does it break decisively above it?
Technical analysis becomes useful when the trader reacts to what price actually does rather than assuming the level must hold.
Previous Highs and Lows
Previous significant highs and lows are among the simplest support and resistance references.
A previous high may become resistance when price approaches it again.
A previous low may become support.
This happens because those levels often represent areas where market participants made important decisions before.
Traders who missed the first move may watch the same region.
Participants already holding positions may also use the old high or low as a place to reduce exposure.
The relationship between swing points and higher highs and lower lows is particularly useful when determining whether support and resistance are forming within a trend or a range.
Support and Resistance in an Uptrend
An uptrend commonly forms higher highs and higher lows.
In this environment, previous resistance can become particularly important.
Suppose EUR/USD breaks above resistance at 1.1000 and rises to 1.1100.
The market later pulls back toward 1.1000.
Traders may watch the old resistance area to see whether it now attracts buyers.
If it does, the former resistance may begin acting as support.
This behavior is often called a role reversal.
The level itself has not changed.
What has changed is how market participants respond to it.
Support and Resistance in a Downtrend
The opposite can happen in a downtrend.
Suppose GBP/USD has support around 1.2700.
Price eventually breaks below it and falls to 1.2550.
Later, GBP/USD rallies back toward 1.2700.
The old support can now become resistance.
Traders who previously bought near 1.2700 may use the recovery as an opportunity to exit.
Short sellers may also view the area as a potential entry zone.
If selling pressure returns, the former support has effectively changed roles.
Support Becomes Resistance
The transition from support to resistance is one of the most widely observed behaviors in chart analysis.
Consider:
Old support: 1.0900
Breakdown: 1.0850
Recovery: back toward 1.0900
If the recovery fails near 1.0900 and price begins falling again, traders may interpret the old support as new resistance.
This does not happen every time.
Some breakouts fail completely, and price can move back above the old level.
The important point is to observe the reaction rather than automatically assuming that every broken level will reverse roles.
Resistance Becomes Support
Resistance can similarly become support after a successful breakout.
Suppose gold struggles repeatedly around 2,500.
Eventually, buyers push the price to 2,530.
Later, gold falls back toward 2,500.
If buyers return around the old breakout area and price begins rising again, traders may treat 2,500 as new support.
This type of retest can provide useful information about whether a breakout is being accepted by the market.
What Makes a Support or Resistance Level Strong?
No formula can identify a guaranteed level, but several characteristics can make an area more noticeable.
A level that has produced substantial reactions may carry more information than one that caused only a tiny pause.
A zone visible on a higher timeframe may also attract more attention.
Repeated reactions can strengthen the market's awareness of a level, although repeated testing can eventually weaken it if buyers or sellers at that area are gradually absorbed.
A level that aligns with broader market structure may also be more useful than one selected arbitrarily.
The aim is not to assign a magical strength score. It is to understand whether the area has demonstrated meaningful market behavior.
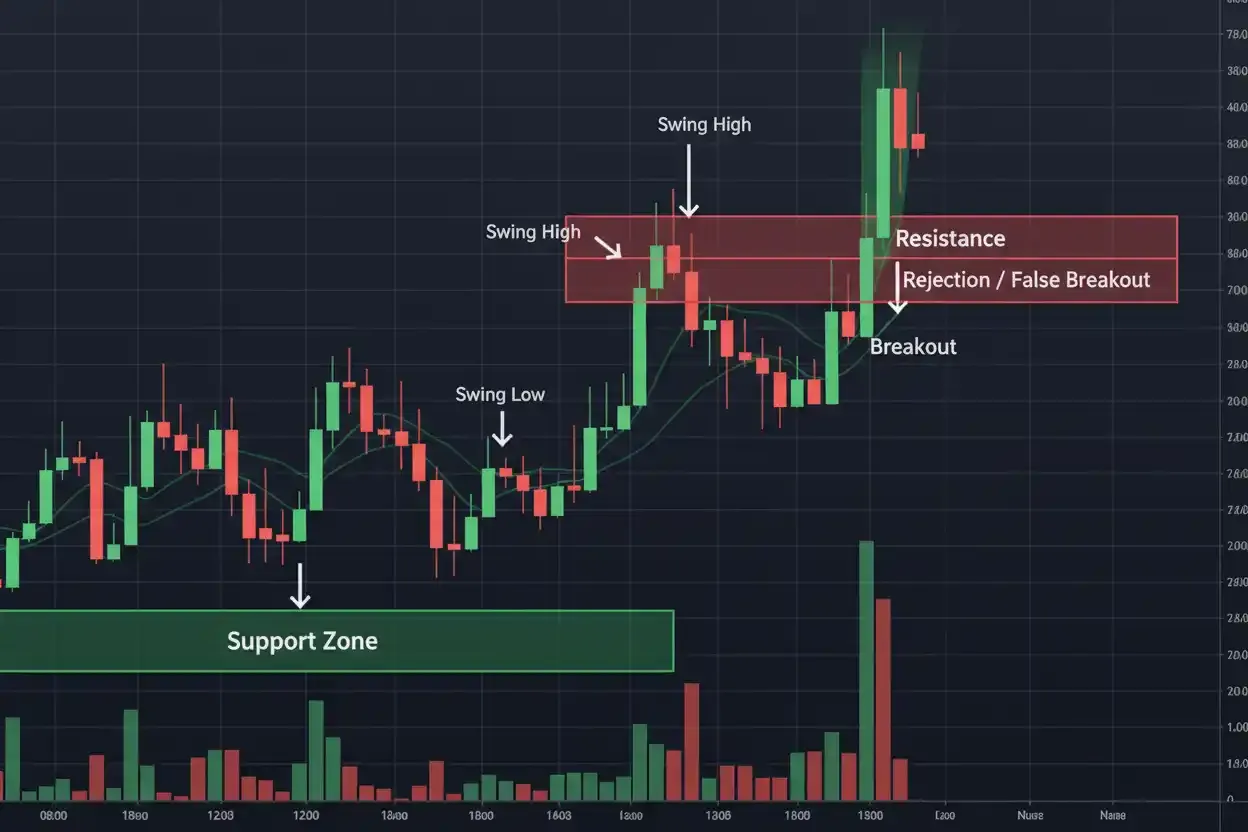
How Many Times Should a Level Be Tested?
There is no fixed number.
A level can matter after one major reaction if that reaction created an important swing high or low.
Repeated tests can confirm that traders are paying attention to the same area.
However, five tests do not automatically make a level stronger than three.
Each test can consume some of the buying or selling interest around the region.
For example, support that repeatedly absorbs selling pressure may eventually fail when demand is no longer sufficient.
The market's response to each test matters more than simply counting touches.
Higher Timeframes and Stronger Context
Support and resistance visible on higher timeframes often represent broader market structure.
A weekly resistance zone may have influenced price for months, while a five-minute level may have formed only minutes earlier.
This does not mean higher-timeframe levels always hold.
It means they represent a larger period of market activity.
Understanding trading chart timeframes helps traders avoid confusing a small intraday level with a major structural area.
A short-term trader can still use lower timeframes, but it helps to know whether a much larger support or resistance zone is nearby.
Multi-Timeframe Support and Resistance
One useful approach is to identify broad levels on a higher timeframe and refine them on a lower timeframe.
Suppose EUR/USD daily resistance appears around:
1.1050–1.1080
A trader can then move to a one-hour chart and study how price behaves inside that zone.
Perhaps repeated hourly highs develop near 1.1065.
That lower-timeframe information can help refine the broader area.
The purpose is not to create endless levels on every timeframe.
It is to connect broad context with more detailed price behavior.
Horizontal Support and Resistance
Horizontal support and resistance are areas that occur around relatively similar prices.
They are usually easy to identify because the trader can draw a horizontal zone across previous highs or lows.
For example:
EUR/USD support: approximately 1.0900
EUR/USD resistance: approximately 1.1050
These zones can help define the boundaries of a range.
They can also identify important breakout areas.
Horizontal levels are often more objective than diagonal trendlines because they rely on repeated activity around similar prices.
Dynamic Support and Resistance
Some traders use moving averages as dynamic support and resistance references.
Unlike a horizontal level, a moving average changes over time.
Suppose price remains above a rising 50-period moving average during an uptrend and repeatedly rebounds after touching it.
A trader may begin treating the average as a dynamic support reference.
The broader concept is discussed in moving averages in trading.
However, a moving average does not literally create support.
It is a calculated line based on previous prices.
The market may react near it because many participants are watching similar information, but price can cross it without warning.
Psychological Price Levels
Round numbers can sometimes attract market attention.
Examples include:
EUR/USD: 1.1000
GBP/USD: 1.3000
Gold: 2,500
These prices are easy for traders to remember and may attract orders.
However, a round number should not automatically be treated as strong support or resistance.
It becomes more useful when price history confirms that market participants have actually reacted around that area.
A psychological number combined with previous highs, lows or broader structure can carry more context than the number alone.
Support and Resistance Breakouts
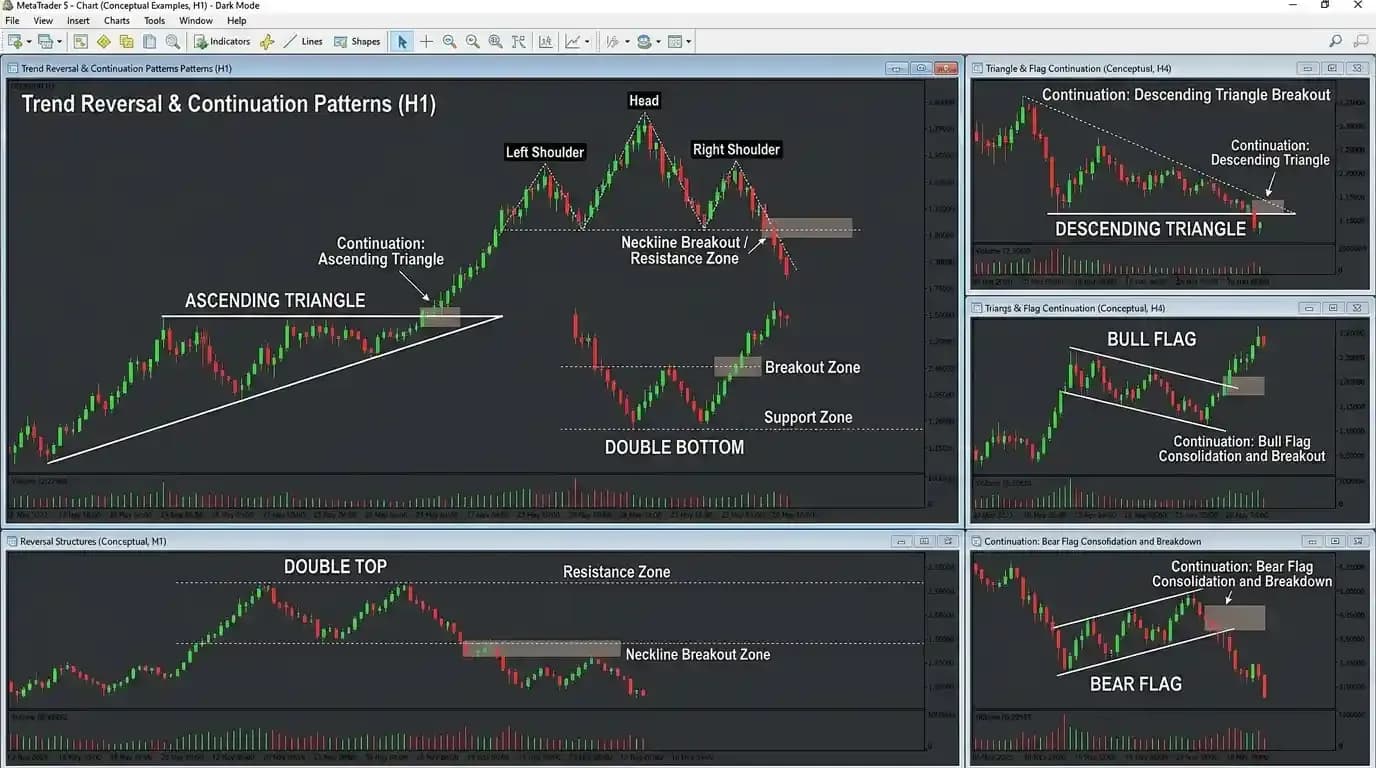
A breakout occurs when price moves beyond an established support or resistance zone.
Suppose EUR/USD has resistance around 1.1050.
Price reaches the area several times but fails to continue higher.
Eventually, EUR/USD moves through 1.1050 and trades at 1.1100.
This can indicate that buying pressure has overcome the selling activity that previously limited price.
A breakout can lead to continuation, but it can also fail.
The key question is whether the market accepts prices beyond the previous boundary.
What Is a False Breakout?
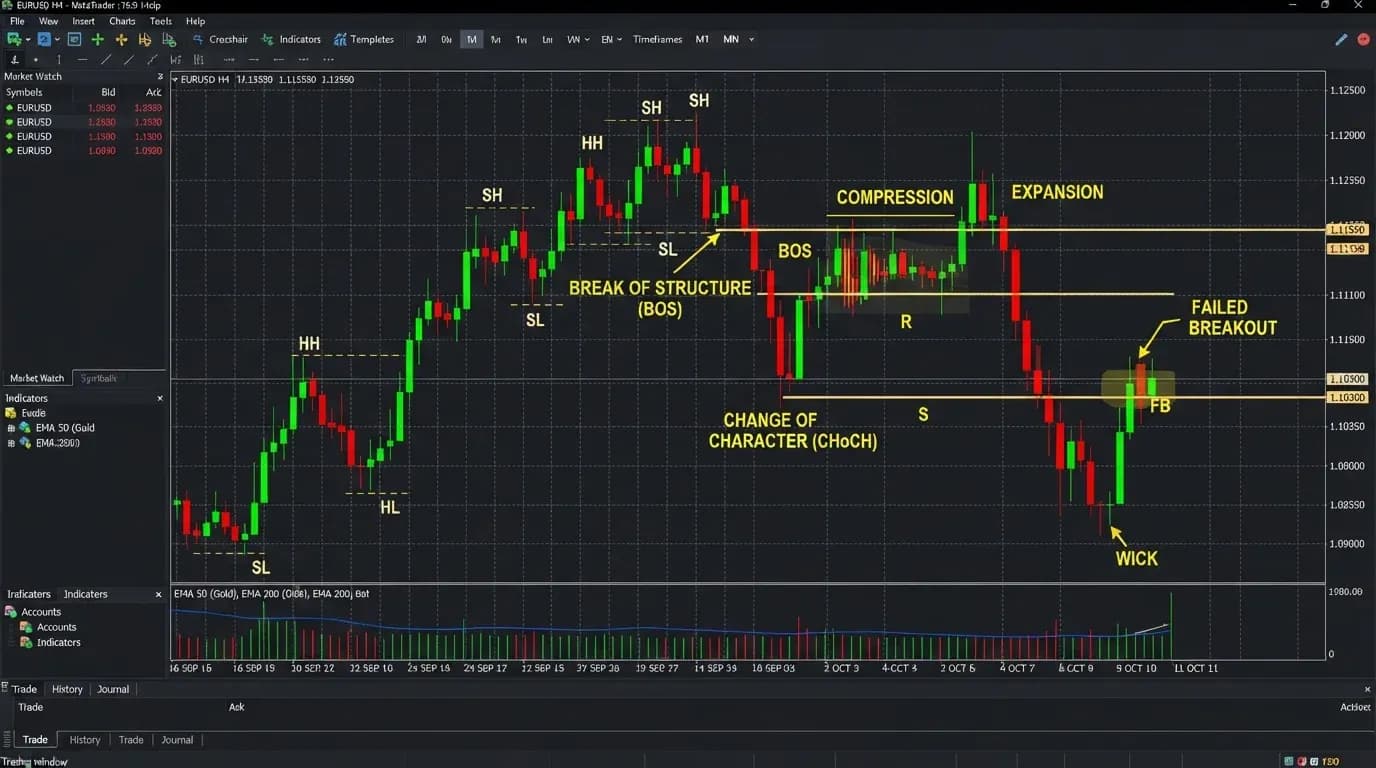
A false breakout occurs when price moves through support or resistance but fails to sustain the move.
Suppose resistance is around 1.1050.
EUR/USD rises to:
1.1065
Traders buy the apparent breakout.
Soon afterward, price falls back below:
1.1050
and returns inside the old range.
This may be considered a false breakout.
Understanding technical analysis false signals is important because breakouts can look most convincing immediately before reversing.
Waiting for additional confirmation can sometimes reduce false entries, although no confirmation technique eliminates them entirely.
Breakout Confirmation
Traders use different methods to judge whether a breakout is meaningful.
Some wait for a candle to close beyond the level.
Others want to see price remain beyond the area for several candles.
Some prefer a breakout followed by a successful retest.
Momentum can also provide context.
A strong breakout accompanied by expanding momentum may look different from a brief move beyond resistance with immediate rejection.
This is where trading confluence becomes useful: multiple independent observations can support an interpretation without turning the chart into a collection of redundant signals.
Retesting Support and Resistance
After breaking a level, price often returns toward the original breakout area.
This is called a retest.
Suppose EUR/USD breaks resistance at 1.1000 and reaches 1.1080.
Later, it falls back toward:
1.1000
If buyers appear around the former resistance, traders may interpret the retest as evidence that 1.1000 has become support.
If EUR/USD falls straight back below 1.1000, the breakout becomes less convincing.
A retest is informative because it shows how the market responds when the old decision area is approached from the opposite direction.
Support and Resistance With Candlesticks
Candlestick behavior can help describe reactions around important zones.
Suppose GBP/USD falls into support and forms a candle with a long lower shadow.
This indicates that price traded below the opening area but recovered before the candle closed.
The candle alone does not guarantee a reversal.
However, a strong rejection at meaningful support may provide more context than the same candle appearing randomly in the middle of a range.
Some traders also use Heikin-Ashi charts to smooth visual trend behavior, though standard candlesticks are generally more direct when exact highs and lows are important.
Support and Resistance With Momentum
Momentum can help traders judge whether price is approaching a level with strength or weakness.
Suppose EUR/USD approaches resistance while upward momentum is increasing.
A breakout may become more plausible.
If price reaches resistance while momentum steadily weakens, the chance of rejection may appear more significant.
Momentum indicators can help organize this information, but they should not override price behavior.
An oscillator saying "overbought" does not guarantee resistance will hold.
Strong trends can remain extended for long periods.
Support and Resistance With Trend Indicators
Trend indicators can add broader directional context.
Suppose EUR/USD is above a rising long-term moving average and repeatedly forming higher lows.
A support area inside that broader uptrend may be interpreted differently from the same support zone during a major downtrend.
The level itself is only part of the analysis.
The surrounding market structure determines whether traders are trying to buy a pullback, fade a range or trade against a dominant trend.
Support and Resistance With the Golden Cross
A golden cross occurs when a shorter-term moving average crosses above a longer-term moving average under a commonly used interpretation.
Some traders combine this broader trend signal with horizontal support.
For example, if price is above both averages and pulls back toward established support, the level may fit the trader's broader bullish view.
This does not make the support certain to hold.
Moving-average relationships are lagging indicators, while support itself can fail.
The combination provides context rather than certainty.
Support and Resistance With Oscillators
Oscillators can help evaluate momentum near a price level.
Consider a market approaching resistance.
If price reaches a new high while momentum fails to make a corresponding high, traders may interpret this as weakening momentum.
An indicator such as the KST indicator strategy can be used as part of momentum analysis.
However, divergence can persist for a long time.
Using an oscillator without considering the actual support and resistance structure can result in premature trades.
Support and Resistance vs Fundamental Analysis
Technical levels do not exist independently of economic events.
EUR/USD may have strong-looking support at 1.0900, but a major change in interest-rate expectations can push price through it rapidly.
Gold may have respected resistance several times until geopolitical news suddenly changes demand.
The difference between chart-based and economic approaches is explored in fundamental vs technical analysis.
Many traders combine them by using fundamentals to understand potential market drivers and support and resistance to organize the price structure.
Support and Resistance in Forex Trading
Support and resistance are widely used in forex trading because major currency pairs often produce visible swing highs, lows and consolidation ranges.
A EUR/USD trader might watch the previous week's high as potential resistance.
A GBP/USD trader may monitor an earlier daily low as support.
Session highs and lows can also become important intraday references.
The level should be evaluated together with liquidity, volatility and scheduled economic events.
A perfectly drawn support zone cannot prevent price from breaking when market expectations change sharply.
Support and Resistance in Gold
Gold frequently reacts around previous highs and lows, psychological levels and major consolidation zones.
Suppose gold has struggled several times around 2,500.
That region may attract attention as resistance.
If price eventually breaks above 2,500, traders can watch whether the level holds on a later pullback.
Gold can also move rapidly when inflation expectations, interest rates or geopolitical developments change.
This means technical levels may be crossed quickly during major events.
Support and Resistance in Indices
Index traders often watch previous market highs and lows, opening ranges and major breakout areas.
A US index may react strongly around a previous record high.
If price repeatedly fails at the level, resistance becomes visible.
If the index later breaks through and holds above it, the old resistance may become support.
Market openings can create unusually strong volatility, making wider zones more practical than exact single-price lines.
Pakistan Time and Support and Resistance
Support and resistance themselves do not change according to a trader's location, but session-specific levels depend on time.
A trader in Peshawar may mark the London-session high or New York-session low while viewing the market in Pakistan Standard Time.
A trader in Abbottabad, Mardan, Nowshera or Swabi may use the same underlying forex price data, but a platform's server timezone can make session boundaries appear different.
Before marking an "Asian session high" or "London low," check which timezone the chart uses.
This prevents a simple clock mismatch from creating incorrect levels.
Support and Resistance for KPK Traders
For traders across Khyber Pakhtunkhwa, the most useful technical approach is usually the one that fits the hours they can realistically monitor.
Someone in Peshawar who follows European forex activity during the daytime may focus on London-session support and resistance.
A trader in Mardan or Abbottabad who prefers US markets may pay closer attention later in the local day.
Someone in Swat, Chitral or another area where connectivity can occasionally be less consistent may prefer broader timeframes rather than setups that require constant monitoring of very small intraday levels.
The chart concept remains unchanged, but the practical use of support and resistance should fit the trader's schedule and access.
Drawing Too Many Levels
A chart can quickly become useless if every high and low receives a line.
If support or resistance is everywhere, it provides little information.
A cleaner approach is to prioritize levels that produced meaningful market reactions.
Ask:
Did price reverse substantially?
Was the level visible on a higher timeframe?
Has the area influenced price more than once?
Does it align with a meaningful swing high or low?
Is price currently close enough for the level to matter?
Reducing clutter makes it easier to see which zones are genuinely important.
Moving Levels to Fit the Trade
Another common mistake is adjusting a support or resistance zone after entering a position simply to avoid admitting that the original idea failed.
Suppose a trader buys at support around 1.0900.
Price breaks decisively below 1.0900.
The trader then changes the support level to 1.0850.
When 1.0850 breaks, support becomes 1.0800.
This is not objective technical analysis.
The original invalidation point should be considered before entering the trade.
Changing the analysis only because a position is losing can turn a manageable loss into a much larger one.
Assuming More Tests Mean a Level Cannot Break
Repeated reactions may make a level more visible, but they do not make it invincible.
Imagine resistance at 1.1000 has rejected price four times.
The fifth test may fail.
Each attempt can absorb available sell orders around the area.
Eventually, enough demand may appear to push through.
Traders should watch how price approaches the level.
A slow weak approach may look different from a strong series of higher lows pressing directly against resistance.
Buying Support Without Confirmation
Support is not automatically a buy signal.
Suppose GBP/USD falls aggressively toward 1.2700.
The level acted as support previously.
If price reaches 1.2700 during heavy selling and immediately continues lower, buying simply because the number appeared on the chart creates unnecessary risk.
Some traders prefer to wait for evidence that selling pressure has actually slowed.
That confirmation might include a rejection, a shift in short-term structure or a recovery above a nearby price level.
The appropriate method depends on the trader's strategy.
Selling Resistance Without Confirmation
The same principle applies to resistance.
A market can approach resistance with extremely strong buying momentum.
Selling immediately because "price is at resistance" ignores current market behavior.
If price pauses, rejects the area and begins making lower highs, the evidence may become more meaningful.
If the market accelerates through the resistance zone, the original short idea may no longer make sense.
Support and resistance identify places to pay attention.
They do not dictate what a trader must do.
Support and Resistance and Risk Management
A level can help define where a trade idea becomes invalid.
Suppose a trader buys near support at:
1.1000
The support zone extends down to:
1.0970
The trader decides that a decisive move below:
1.0960
would invalidate the setup.
The distance between entry and invalidation becomes part of the position-sizing calculation.
A technical level should not be used to justify arbitrary financial exposure.
Risk still depends on how much money is attached to each unit of price movement.
A Simple Support Trade Example
Suppose EUR/USD has repeatedly reacted around:
Support: 1.0900
The market is currently:
1.0920
Price falls toward 1.0900, reaches 1.0895 and then quickly recovers above 1.0910.
A trader considers this rejection meaningful and plans:
Entry: 1.0910
Invalidation: 1.0870
Potential target: 1.0990
The approximate downside distance is 40 pips.
The intended upside distance is 80 pips.
This gives a nominal reward-to-risk relationship of:
80 ÷ 40 = 2
The calculation does not tell us the probability of success.
The support can still fail.
It simply defines the structure of the trade before execution.
A Simple Resistance Trade Example
Suppose GBP/USD has repeatedly failed near:
Resistance: 1.2850
Price rises to 1.2855 but closes back below 1.2835.
A trader interprets the rejection as a possible short setup.
The plan might be:
Entry: 1.2830
Invalidation: 1.2880
Potential target: 1.2730
The stop distance is approximately 50 pips.
The target distance is approximately 100 pips.
Again, this does not mean the market will fall.
It means the trader has defined both the idea and the point where that idea would be considered wrong.
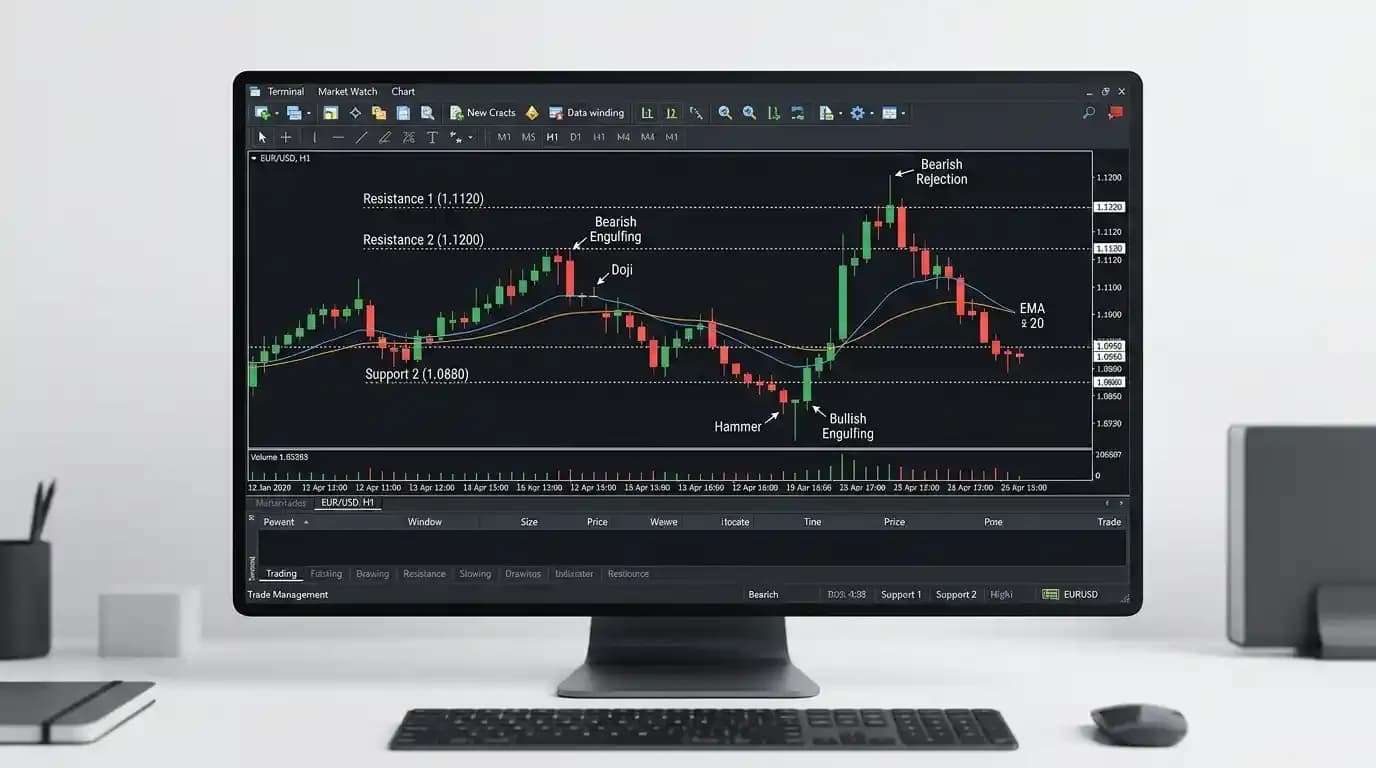
Support and Resistance on MetaTrader 5
Medatiq traders can use the MetaTrader 5 platform to view supported instruments across multiple timeframes and mark horizontal price areas directly on charts.
A useful routine is to begin with a clean chart.
Identify major swing highs and lows.
Mark only the most meaningful zones.
Then move to the trading timeframe and observe current price behavior.
Indicators can be added afterward if they provide genuinely useful information.
The platform makes drawing levels easy, but the quality of the analysis depends on choosing meaningful areas rather than simply adding more lines.
Support and Resistance and the Broader Market
Technical levels become more useful when considered alongside the characteristics of the instrument being traded.
Forex pairs respond strongly to currency-specific economic developments.
Gold can react to interest rates, inflation expectations and geopolitical uncertainty.
Indices can move sharply around market openings and major economic releases.
The broader Medatiq trading services cover different market types, and the same support and resistance concept may require different zone widths and risk assumptions across those instruments.
A ten-pip level on EUR/USD and a ten-point level on a volatile index do not represent equivalent market behavior.
Building Better Technical Judgment
Support and resistance become more useful with practice because traders gradually learn to distinguish meaningful structure from random chart noise.
Start by identifying major highs and lows rather than every small fluctuation.
Observe how price behaves when returning to those areas.
Notice whether the market rejects the level, consolidates around it or breaks straight through.
Compare the behavior across different timeframes.
Then consider whether momentum and trend agree with the level.
This process builds a more realistic understanding than memorizing rules such as "buy support and sell resistance."
Support and Resistance FAQs
What are support and resistance?
Support is an area where falling price has previously attracted enough buying pressure to slow or reverse a decline. Resistance is an area where rising price has previously encountered enough selling pressure to slow or reverse.
Is support an exact price?
Usually not. Support is often better treated as a zone because market reactions rarely occur at precisely the same price every time.
Is resistance an exact price?
No. Resistance commonly covers a range of prices around previous highs or selling areas rather than one perfect number.
How do I find support?
Look for meaningful previous lows, repeated rebounds, consolidation boundaries and areas where declines produced substantial reversals.
How do I find resistance?
Look for previous highs, repeated rejections and zones where rising prices previously reversed or stalled.
Can old resistance become support?
Yes. After price breaks above resistance, the same area can sometimes attract buyers during a later pullback.
Can old support become resistance?
Yes. A broken support area can sometimes become resistance when price later recovers toward it.
Does support always hold?
No. Every support level can break when selling pressure becomes stronger than demand around the area.
Does resistance always hold?
No. Resistance can fail when buying pressure is strong enough to push price through the zone.
What is a support and resistance breakout?
A breakout occurs when price moves beyond an established support or resistance area and begins trading on the other side.
What is a false breakout?
A false breakout occurs when price moves beyond a level but quickly returns inside the previous range instead of continuing.
Is support and resistance useful for forex?
Yes. Forex traders frequently use previous highs, lows and consolidation boundaries to understand currency-pair structure.
Can support and resistance be used for gold?
Yes. Gold often reacts around previous highs, lows, round-number areas and major consolidation zones, although volatility can make broader zones necessary.
Can support and resistance be used for indices?
Yes. Index traders commonly monitor previous session highs and lows, major structural levels and breakout areas.
Which timeframe is best for support and resistance?
There is no universal best timeframe. Higher timeframes generally provide broader levels, while lower timeframes show more detailed intraday structure.
Are higher-timeframe levels stronger?
They often represent more market activity and broader structure, but they can still fail.
How many times should support be tested?
There is no required number. The quality of previous reactions matters more than simply counting touches.
Should I buy every support level?
No. Support identifies an area worth watching, not an automatic instruction to buy.
Should I sell every resistance level?
No. Strong trends can break through resistance, so current price behavior and broader context matter.
Can indicators confirm support and resistance?
Indicators can add momentum or trend context, but no indicator guarantees that a level will hold.
Does support and resistance work differently in Pakistan?
The chart concept is global. Traders in Pakistan mainly need to account for session timing, platform timezone and the hours they can realistically monitor.
Is support and resistance different for KPK traders?
No. A trader in Peshawar, Mardan, Swat, Abbottabad, Kohat or another KPK city sees the same underlying market structure for the same instrument. Local time and connectivity affect the practical trading routine rather than the technical concept.
Can support and resistance guarantee profitable trades?
No. Levels fail regularly, and unexpected market events can cause rapid breakouts. Risk management remains necessary even when a level appears technically strong.
Disclaimer: Support and resistance levels are interpretations of previous price behavior, not barriers that markets are required to respect. A level that has produced several earlier reactions can still break suddenly, particularly during volatile market conditions, and leveraged positions can magnify resulting losses. This article is intended for general education and does not provide personal investment, trading, financial, legal or tax advice. Medatiq's supported instruments, spreads, execution conditions, margin requirements and account features may differ by market or change over time.
Trade forex, gold, and indices with Medatiq Markets
Enjoy tight spreads and fast execution, built for market condition.