Momentum Indicators: Complete Trading Guide
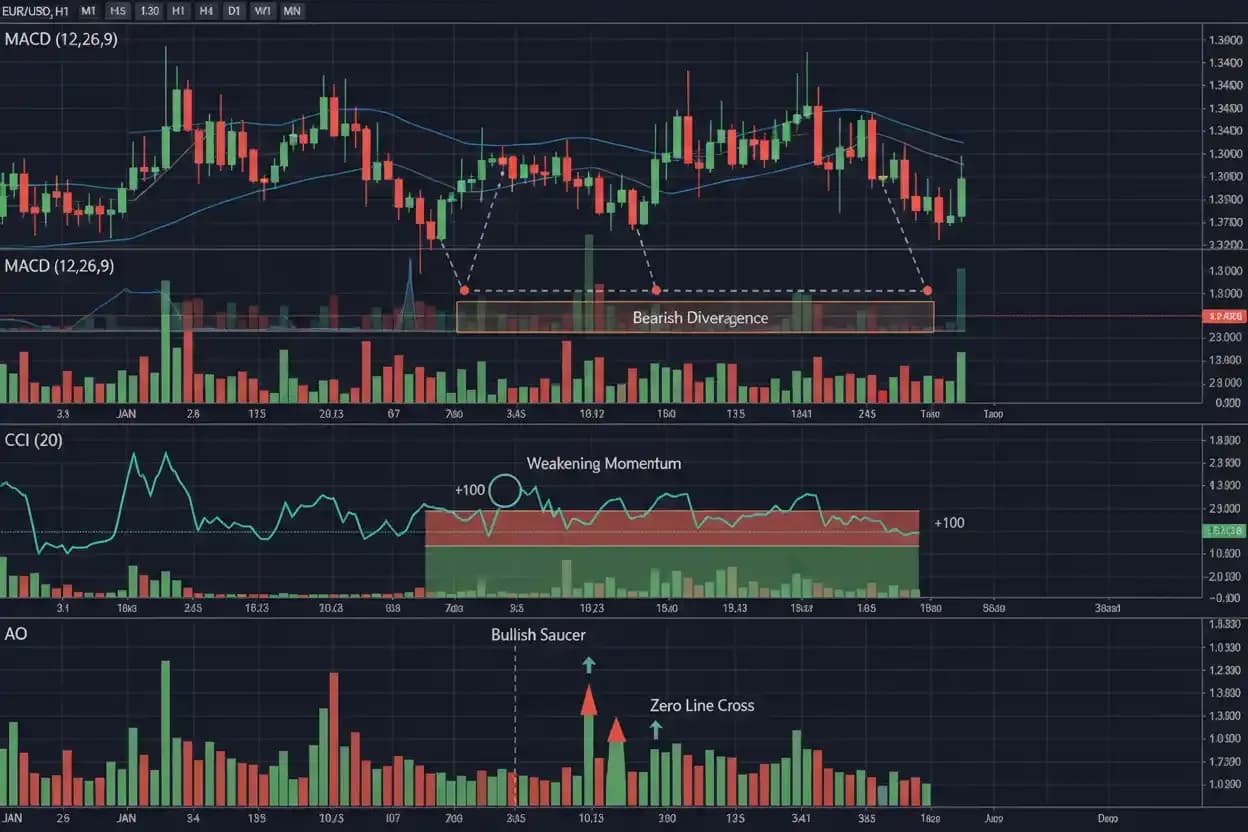
Momentum indicators help traders measure the speed and strength of price movement rather than simply identifying whether a market is rising or falling. A currency pair can move higher while momentum is accelerating, move higher while momentum is fading, or remain almost unchanged while buying and selling pressure shifts beneath the surface. Momentum indicators transform price data into values that make these differences easier to examine. Traders commonly use them to identify strengthening trends, weakening moves, overextended conditions, divergences and possible changes in market behavior. Popular examples include MACD, the Commodity Channel Index, the Awesome Oscillator and other rate-of-change or oscillator-based tools. These indicators can provide useful context in forex, gold, indices and other active markets, but none can predict a reversal or continuation with certainty. They work best when combined with price structure, trend direction, support and resistance, volatility and disciplined risk management.
Momentum analysis complements moving averages trading, which focuses more heavily on smoothed direction, while the broader principles of technical analysis for trading provide the chart context in which momentum signals become meaningful.
What Are Momentum Indicators?
Momentum indicators are technical calculations designed to describe how quickly or strongly market prices are changing.
They do not all use the same formula.
Some compare current price with an earlier price.
Others compare moving averages.
Some measure how far price has moved relative to a recent range.
Despite these differences, the underlying question is similar:
How strong is the current price movement compared with recent market behavior?
Suppose EUR/USD rises from 1.1000 to 1.1020 over several hours.
That is an upward move.
Now suppose it rises from 1.1000 to 1.1080 during the same amount of time.
The direction is still upward, but the second move contains much greater momentum.
A momentum indicator attempts to quantify that difference.
Direction and Momentum Are Not the Same
Direction tells us whether price is moving higher or lower.
Momentum tells us something about the intensity of that movement.
A market can be:
- Rising with increasing momentum
- Rising with decreasing momentum
- Falling with increasing downside momentum
- Falling while downside momentum weakens
- Moving sideways with little momentum
This distinction matters because price direction can remain unchanged even while the character of the move changes.
For example, gold may continue making higher highs, but each upward push may become smaller.
Price remains bullish on the surface, yet momentum may be fading.
That does not guarantee a reversal, but it gives the trader additional information.
How Momentum Is Calculated
A basic momentum calculation compares the current price with the price from a specified number of periods earlier.
A simplified formula is:
Momentum = Current Price − Price n Periods Ago
Suppose EUR/USD is currently:
1.1050
and ten periods earlier it was:
1.1000
Then:
Momentum = 1.1050 − 1.1000
Momentum = 0.0050
If the current price rises faster relative to the earlier price, the calculated momentum increases.
Different indicators transform this idea in different ways, but most are ultimately derived from historical market prices.
Why Traders Use Momentum Indicators
Momentum indicators can help traders answer questions that are difficult to judge from direction alone.
Is a breakout gaining strength?
Is an established trend slowing?
Is a pullback losing momentum?
Is price reaching an unusually extended condition?
Is an indicator confirming a new price high?
Has the market's rate of change started shifting before the broader trend changes?
These observations can improve context, but they should not be treated as automatic trade instructions.
A momentum indicator can weaken while price continues trending for a long time.
It can also turn upward temporarily during a larger decline.
The surrounding chart structure remains important.
Momentum Indicators vs Trend Indicators
Momentum and trend are related but different.
Trend indicators generally help traders determine direction or the persistence of a directional move.
Momentum indicators focus more on the speed or force behind price changes.
Suppose EUR/USD is above a rising 50-period moving average.
That supports an upward trend interpretation.
Now suppose momentum begins declining.
The two observations are not necessarily contradictory.
The market can remain in an uptrend while the pace of the advance slows.
This situation may result in consolidation, a pullback or eventually a reversal, but the momentum reading alone cannot determine which outcome will occur.
Oscillators
Many momentum indicators are displayed as oscillators below the main price chart.
An oscillator moves within a defined range or around a central reference level.
Instead of following the absolute price of the market, it represents a mathematical relationship derived from recent price behavior.
Some oscillators use fixed upper and lower boundaries.
Others move around zero.
The location, direction and rate of change of the oscillator can help traders assess momentum.
However, the numerical scale itself should always be interpreted according to the indicator's formula.
A reading of 70 means something completely different on one indicator than it might on another.
Overbought Conditions
Some momentum indicators describe high readings as overbought.
This generally means the market has experienced unusually strong recent upward movement relative to the indicator's calculation.
It does not mean that price must fall.
Suppose an oscillator reaches its overbought region while EUR/USD is breaking into a strong trend.
Price may continue rising for many periods while the oscillator remains elevated.
Selling simply because the indicator says overbought can mean repeatedly trading against a powerful trend.
The reading should instead be interpreted as evidence that recent upward momentum has been strong.
What happens next still needs to be determined from price.
Oversold Conditions
An oversold reading generally indicates unusually strong recent downward movement.
Again, it is not an automatic buy signal.
During a major decline, an oscillator can remain oversold while price continues falling.
A trader who repeatedly buys because an indicator appears oversold can accumulate losses as the trend persists.
Oversold conditions become more useful when combined with evidence such as weakening downside structure, support, improving momentum or a change in price behavior.
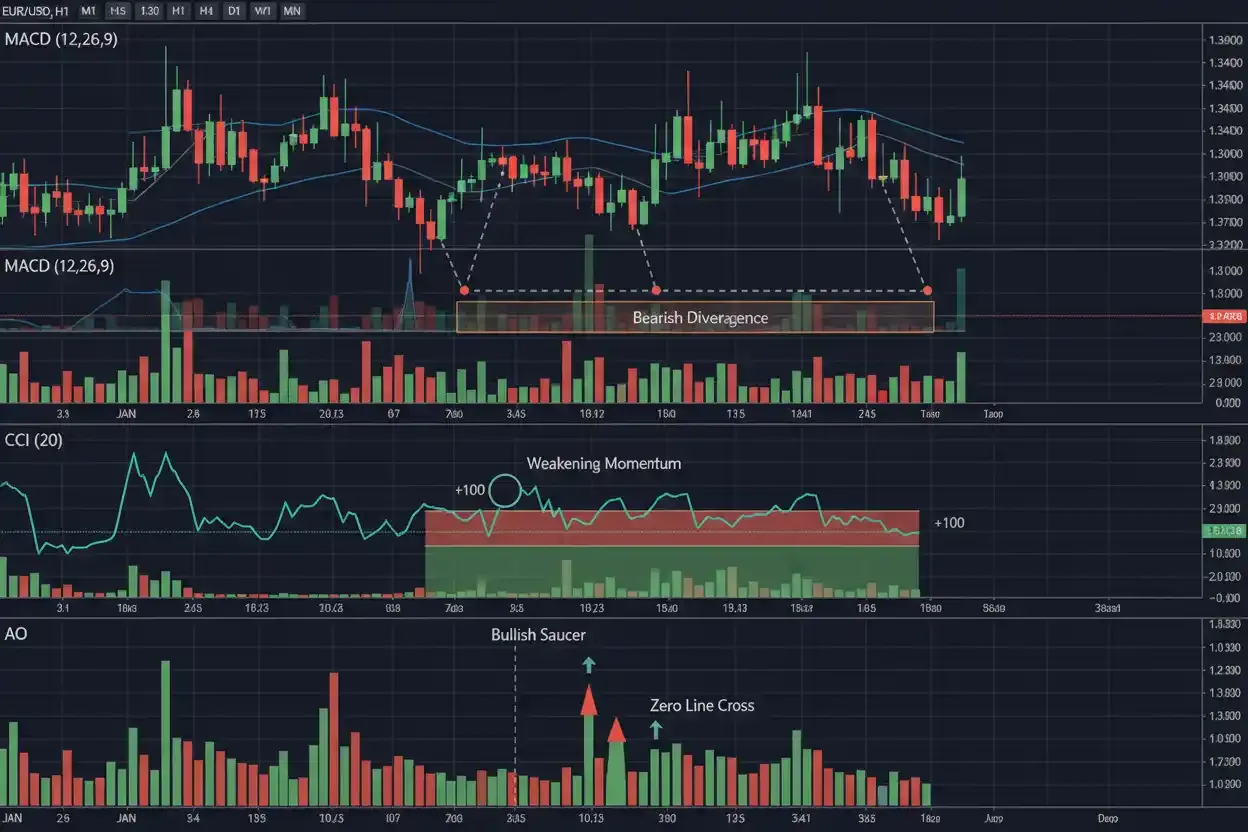
Momentum Divergence
Divergence occurs when price and a momentum indicator move differently.
A common bullish divergence occurs when price makes a lower low while the indicator forms a higher low.
A bearish divergence can occur when price makes a higher high while momentum forms a lower high.
The idea is that price continues moving in one direction while the force behind the movement appears to weaken.
Divergence can be informative.
It can also persist for a long time without producing a reversal.
This is why divergence should normally be treated as a warning or context signal rather than an immediate entry instruction.
Bullish Divergence Example
Suppose GBP/USD forms:
First low: 1.2700
Second low: 1.2650
Price has made a lower low.
Meanwhile, a momentum oscillator forms:
First low: -80
Second low: -60
The indicator has formed a higher low.
This may suggest that selling momentum is weakening even though price has reached a new low.
A trader might then watch for additional evidence, such as a break above short-term resistance or a shift from lower highs to higher highs.
Without confirmation, the divergence can continue while GBP/USD falls further.
Bearish Divergence Example
Suppose gold makes:
First high: 2,500
Second high: 2,530
Price makes a higher high.
The momentum indicator, however, forms:
First high: 85
Second high: 72
Momentum has not confirmed the new price high.
A trader may interpret this as weakening upside force.
That still does not mean gold must immediately decline.
During strong trends, several divergences can develop before price eventually changes direction.
Hidden Divergence
Some traders also distinguish hidden divergence from regular divergence.
Hidden divergence is typically used as a possible continuation signal.
For example, price may form a higher low in an uptrend while the momentum indicator forms a lower low.
Traders may interpret this as evidence that the broader trend remains stronger than the temporary pullback suggests.
This is a more advanced use of momentum analysis.
The same limitation applies: divergence describes a relationship between price and an indicator, not a guaranteed future outcome.
Momentum Confirmation
Momentum becomes useful when it confirms price behavior.
Suppose EUR/USD breaks above resistance.
Price moves to a new high, and momentum also reaches a stronger reading.
This suggests that the breakout is accompanied by increasing buying force.
Contrast that with price barely moving through resistance while momentum declines sharply.
The second breakout may deserve more caution.
This kind of confirmation can add useful information to support and resistance analysis without assuming that every strong momentum reading guarantees continuation.
Momentum During Trends
Strong trends often maintain momentum for longer than expected.
In an uptrend, momentum may repeatedly rise, decline temporarily and then strengthen again.
The temporary weakening does not necessarily mean the trend has ended.
A useful distinction is between:
Momentum pullback: short-term weakening while price structure remains intact.
Trend reversal: price begins changing its broader sequence of highs and lows.
A momentum indicator can help identify the first.
Price structure is usually more important for confirming the second.
Momentum During Sideways Markets
Momentum indicators can behave very differently inside ranges.
Suppose EUR/USD moves repeatedly between:
Support: 1.0950
Resistance: 1.1050
Momentum may become strong near one side of the range and then reverse as price approaches the opposite boundary.
Oscillators can sometimes appear more useful in such environments because the market repeatedly shifts between short-term buying and selling pressure.
However, every range eventually ends.
A momentum signal that worked several times inside the range can fail sharply when price breaks out.
Awesome Oscillator
The Awesome Oscillator compares short-term and longer-term market momentum using moving averages calculated from median price.
It is commonly displayed as a histogram around a zero line.
Positive values suggest shorter-term momentum is stronger relative to the longer calculation.
Negative values indicate the opposite relationship.
Traders may look at:
- Zero-line crosses
- Changes in histogram direction
- Momentum expansion
- Divergence
The corresponding Awesome Oscillator strategy can use these signals within a wider trend or market-structure framework.
A zero-line cross by itself does not guarantee a sustainable directional move.
Commodity Channel Index
The CCI, or Commodity Channel Index, measures how far current price has moved relative to its statistical average over a selected period.
Although its name comes from commodities, traders apply it to many markets.
CCI can move above and below a central zero level and frequently reaches values such as:
+100
-100
Some traders interpret high positive readings as strong upward momentum and low negative readings as strong downside momentum.
Others use the indicator to identify potential overextended conditions.
The CCI strategy chosen determines how these readings are interpreted.
A high CCI can indicate strong trend momentum rather than an immediate reason to sell.
Detrended Price Oscillator
The Detrended Price Oscillator attempts to remove longer-term trend effects so shorter cycles become easier to observe.
Unlike many tools designed primarily to follow trends, the DPO focuses attention on fluctuations around a smoothed price reference.
This can help traders examine cyclical behavior.
However, removing trend information does not make future cycles predictable.
Markets can change rhythm.
A cycle visible over the previous several observations may shorten, lengthen or disappear.
A Detrended Price Oscillator strategy should therefore be evaluated against current structure rather than assuming market cycles repeat perfectly.
MACD
MACD is one of the most widely used momentum and trend-following tools.
Its core calculation is based on the difference between exponential moving averages.
A common setup compares a shorter EMA with a longer EMA and then applies another average as a signal line.
Simplified:
MACD Line = Fast EMA − Slow EMA
A signal line is then calculated from the MACD line.
Traders observe:
- MACD crossing above or below the signal line
- Movement above or below zero
- Histogram expansion and contraction
- Divergence from price
A MACD strategy can combine these signals with trend and support or resistance.
MACD still lags because its calculations ultimately come from historical prices.
MACD Histogram
The histogram shows the difference between the MACD line and its signal line.
When the histogram expands above zero, bullish momentum may be strengthening.
When it contracts, upward momentum may be weakening.
The same logic applies below zero for bearish momentum.
A shrinking positive histogram does not necessarily mean price will fall.
It means the relationship between the calculated momentum measures is becoming less positive.
The market could consolidate, pull back slightly or reverse more substantially.
Price action determines which scenario develops.
KST Indicator
The Know Sure Thing, or KST, combines several smoothed rate-of-change calculations.
Despite the confident-sounding name, it does not provide certainty.
The indicator attempts to capture momentum across multiple time horizons.
Traders may watch line crossovers, zero-line behavior and divergence.
A KST indicator strategy can be useful when the indicator's movements are interpreted alongside the prevailing market structure.
Because KST combines several calculations, its signal can lag significant price turns.
This lag should be understood rather than mistaken for a defect.
Rate of Change
Rate of change measures how much price has changed relative to an earlier value.
A simplified percentage formula is:
ROC = ((Current Price − Previous Price) ÷ Previous Price) × 100
Suppose an instrument moves from:
100 to 105
Then:
ROC = ((105 − 100) ÷ 100) × 100
ROC = 5%
A larger positive rate indicates stronger upward movement over the selected lookback.
A larger negative value indicates stronger downside movement.
Changing the lookback period can produce very different results, which is why indicator settings should match the trading horizon.
Momentum Indicator Settings
Momentum indicators usually contain one or more adjustable parameters.
Shorter settings respond faster.
Longer settings respond more slowly.
Suppose a momentum oscillator uses a 10-period lookback.
It may react sharply to recent changes.
A 30-period version smooths more of those short-term fluctuations.
Neither is automatically superior.
A very sensitive indicator can generate frequent signals but also more noise.
A slower indicator can provide cleaner information but recognize changes later.
The same responsiveness-versus-stability trade-off appears throughout technical analysis.
Momentum and Moving Averages
Momentum indicators and moving averages can complement each other.
A moving average may establish trend direction.
Momentum can describe the strength of the current move within that trend.
Suppose EUR/USD is above a rising 50 EMA.
That supports an upward directional bias.
Momentum then weakens during a pullback.
Instead of treating the weakening momentum as bearish by itself, a trader watches what happens as price approaches support.
If momentum begins improving while price forms another higher low, the trend may remain intact.
The indicators are most useful when each contributes different information.
Momentum and Support and Resistance
Momentum can help traders evaluate how price approaches a technical level.
Suppose GBP/USD is moving toward resistance.
Scenario A:
Price accelerates upward, candles expand and momentum strengthens.
Scenario B:
Price approaches resistance slowly while momentum forms lower peaks.
The resistance zone is identical, but the approach looks different.
Scenario A may create greater breakout potential.
Scenario B may suggest weakening buying pressure.
Neither guarantees an outcome, but the momentum context improves the analysis.
Momentum and Breakouts
Breakouts often attract momentum traders because genuine directional moves can accelerate after important levels fail.
Suppose EUR/USD breaks above 1.1050 resistance.
If momentum expands alongside price and the market sustains the breakout, the move may appear stronger.
If price moves slightly above 1.1050 while momentum immediately contracts, the breakout may deserve more caution.
This does not mean low momentum guarantees failure.
It simply helps distinguish strong participation from a marginal move through the level.
Momentum and False Breakouts
False breakouts are common.
A market can accelerate above resistance, attract buyers and then reverse sharply.
Even a strong momentum reading cannot eliminate this possibility.
This is one reason technical analysis false signals should be expected rather than treated as unusual.
Momentum indicators describe current conditions.
They do not know whether new buying will continue arriving after the breakout.
Risk should therefore be controlled even when price and momentum appear perfectly aligned.
Momentum and Trading Confluence
Trading confluence becomes useful when momentum is combined with information measuring something different.
Suppose gold is:
- Above a rising moving average
- Forming higher highs and higher lows
- Pulling back toward established support
- Showing improving momentum after the pullback
These observations cover trend, structure, location and momentum.
That is different from adding five momentum oscillators that all respond to the same price move.
More indicators do not necessarily mean more evidence.
Useful confluence comes from combining different perspectives.
Momentum Indicator Strategy
A general momentum indicator strategy can be built around confirmation rather than prediction.
For example, a trader could first identify a trend.
Next, wait for a pullback.
Then observe whether downside momentum weakens as price reaches support.
Finally, enter only after price begins confirming renewed upward movement.
The momentum indicator does not create the setup by itself.
It helps describe whether the pullback is losing strength.
This approach can be more robust than buying whenever an oscillator simply reaches a low number.
Example of Momentum Continuation
Suppose EUR/USD is trending upward.
Price structure shows:
Higher high: 1.1050
Higher low: 1.0990
Higher high: 1.1100
EUR/USD then pulls back toward:
1.1030
Momentum declines during the pullback.
This is expected because price is moving lower.
Near support, however, downside momentum begins to weaken.
Price stops making new lows and then breaks above a short-term swing high.
A trader may interpret the combination as evidence that the broader upward trend is resuming.
The setup can still fail, but the analysis uses momentum in context rather than in isolation.
Example of Weakening Momentum
Suppose gold rises:
2,450 → 2,500 → 2,530
Price makes a new high.
The momentum indicator, however, peaks strongly during the first advance and records progressively weaker peaks afterward.
This suggests that each new high is being achieved with less momentum according to the calculation.
A trader may become more cautious about chasing the market higher.
That does not automatically justify a short position.
Price may continue rising despite weakening momentum.
Waiting for actual structural weakness can reduce premature reversal trades.
Momentum and Trend Reversals
A reversal usually involves more than one momentum shift.
A market can lose momentum, consolidate and then resume the original trend.
For a stronger reversal case, traders may look for a sequence such as:
Momentum weakens.
Price fails to make a meaningful new high.
Support breaks.
A lower high develops.
Downside momentum strengthens.
This provides much more information than a single oscillator turning downward.
Price structure confirms whether the momentum change is affecting the broader market.
Momentum and Pullbacks
Temporary momentum weakness is normal during pullbacks.
Suppose GBP/USD is in an uptrend and declines for several candles.
A momentum oscillator falls sharply.
That does not necessarily mean the overall trend has reversed.
The trader needs to determine whether:
- The higher low remains intact.
- Broader support still holds.
- The longer-term trend remains upward.
- Momentum begins stabilizing near the pullback area.
This distinction prevents short-term indicator movement from being mistaken for a full structural reversal.
Momentum and Volatility
Momentum and volatility are related but not identical.
Momentum describes directional force.
Volatility describes the size or dispersion of price changes.
A highly volatile market can move rapidly up and down without maintaining directional momentum.
Another market may trend steadily with moderate volatility.
This distinction becomes clearer when comparing momentum tools with dedicated volatility indicators.
A momentum trader should know whether a large indicator reading reflects genuine directional pressure or simply unusually wide price movement.
Momentum and Ichimoku
The Ichimoku Cloud strategy combines several forms of trend, momentum and support/resistance information.
A trader might use momentum indicators alongside Ichimoku, but care is needed to avoid duplication.
If both tools are effectively confirming the same price acceleration, the apparent agreement may not provide as much independent evidence as it seems.
Combining indicators intelligently means understanding what each one measures.
Momentum Indicators in Forex Trading
Momentum indicators are widely used in forex trading.
Currency pairs often move strongly after economic releases, changes in interest-rate expectations or major technical breakouts.
A forex trader may use momentum to evaluate whether EUR/USD is accelerating after breaking resistance or whether GBP/USD is losing strength during an established trend.
Momentum can also help compare market behavior across trading sessions.
A quiet Asian period may produce relatively weak momentum, while London or New York activity may create stronger directional movement.
The indicator itself should always be interpreted relative to the session and market conditions.
Momentum Indicators in Gold
Gold can produce strong momentum when expectations surrounding interest rates, inflation or geopolitical risk shift.
A momentum indicator may expand rapidly during these moves.
Traders should be careful about assuming that an extreme reading means gold is immediately due to reverse.
During powerful trends, strong momentum can remain elevated.
The more useful question is whether momentum continues confirming price or begins changing while the market approaches significant structure.
Momentum Indicators in Indices
Major indices can experience strong directional momentum around market openings, economic announcements and changes in broader risk sentiment.
A trader may use momentum to determine whether an index breakout is accelerating or losing force.
US indices are particularly relevant for traders in Pakistan during later local hours.
A momentum signal appearing around the US market open may behave very differently from one generated during a quiet period.
Time-of-day context can therefore matter as much as the indicator reading.
Momentum Indicators in Cryptocurrency Markets
Momentum tools can also be applied to supported cryptocurrency instruments.
Crypto markets can accelerate rapidly, producing extreme oscillator readings.
This can make momentum indicators visually attractive, but it also increases the risk of interpreting an extreme reading incorrectly.
A cryptocurrency instrument can remain strongly overbought or oversold while continuing in the same direction.
Momentum should therefore be paired with position sizing and actual price structure rather than used to justify aggressive countertrend trades.
Momentum Indicators on MetaTrader 5
Medatiq users can apply technical indicators through the MetaTrader 5 platform for supported instruments.
MT5 provides chart panels where momentum tools can be displayed below price.
When adding an indicator, traders should understand:
- The calculation period
- The price input
- The reference levels
- Whether the indicator has fixed boundaries
- Whether it is trend-following or oscillator-based
- How the selected timeframe changes the signal
Using default settings without understanding what they represent can lead to poor interpretation.
Timeframes and Momentum Indicators
Momentum readings depend heavily on timeframe.
A 15-minute indicator can show strong bullish momentum while a four-hour indicator remains bearish.
This is not necessarily a contradiction.
The shorter timeframe may be showing a temporary rally within a larger decline.
For example:
Four-hour trend: bearish
One-hour momentum: improving
15-minute momentum: strongly bullish
The market may simply be experiencing a short-term recovery.
Comparing momentum across trading chart timeframes helps prevent lower-timeframe movement from being mistaken for a complete change in the broader trend.
Momentum Indicators and Pakistan Time
Momentum calculations are global, but the market session generating the movement matters.
A trader in Pakistan may see relatively quiet forex momentum during one part of the day and much stronger movement when European or US trading becomes active.
Someone in Peshawar following EUR/USD during the London session may experience different volatility and momentum from someone trading the same pair during a quieter period.
The indicator uses price data regardless of location.
What changes is when the most active market conditions occur relative to Pakistan Standard Time.
Momentum Trading in Khyber Pakhtunkhwa
For traders in Peshawar, Mardan, Abbottabad, Swat, Kohat, Nowshera, Mansehra, Haripur, Swabi or other parts of KPK, momentum analysis should fit the time available for monitoring markets.
A short-term momentum setup can change quickly.
Someone who cannot watch the market continuously may prefer higher timeframes where signals develop more slowly.
A trader who follows European forex activity during Pakistan's daytime may use different timeframes from someone who focuses on US markets later in the local day.
The underlying calculations remain identical, but a useful strategy should fit the trader's actual routine.
Connectivity and Short-Term Momentum Trading
Fast momentum strategies can require rapid execution and frequent monitoring.
If connectivity becomes unstable, a setup based on small price moves can become difficult to manage.
This does not make momentum indicators unusable.
It means the timeframe and position structure should match practical conditions.
A four-hour momentum setup provides more decision time than a one-minute signal.
Traders should avoid choosing a strategy that depends on perfect connectivity if their real environment cannot reliably provide it.
Momentum Indicators and Risk Management
A strong momentum reading says nothing about appropriate position size.
Suppose EUR/USD breaks resistance with rapidly increasing momentum.
The setup appears attractive.
The trader still has to decide:
Where is the analysis invalid?
How far is the stop?
How much account capital is at risk?
How much leverage is involved?
A momentum signal can fail immediately after entry.
Risk management determines whether that failure is manageable.
Common Momentum Indicator Mistakes
One common mistake is selling because an oscillator is overbought.
Another is buying simply because it is oversold.
Traders also frequently treat divergence as proof of an approaching reversal.
Some add several oscillators and assume that agreement between them creates independent confirmation.
Another mistake is changing indicator settings repeatedly until historical charts look perfect.
Each of these problems comes from treating a mathematical tool as more predictive than it really is.
Using Too Many Momentum Indicators
Suppose a trader uses:
- MACD
- CCI
- Awesome Oscillator
- Rate of Change
- KST
All five become bullish.
This may look like powerful confirmation.
However, all five are derived from the same underlying price movement.
Their agreement may simply be multiple mathematical descriptions of one event.
A better framework might combine one momentum tool with market structure, trend and volatility.
This reduces redundant information.
Chasing Momentum
Strong price movement can create fear of missing out.
A trader sees momentum expanding and enters after a large move has already occurred.
The market then pulls back normally, producing an immediate loss.
Momentum trading does not mean buying every fast rise or selling every fast decline.
Entry location still matters.
A move can have strong momentum and still be temporarily overextended relative to nearby structure.
Fading Strong Momentum Too Early
The opposite mistake is automatically trading against strong momentum.
An indicator becomes overbought, so the trader sells.
Price rises further.
The indicator remains overbought.
The trader sells again.
Strong trends can persist much longer than expected.
Countertrend trades generally require more evidence than a high or low oscillator reading.
Indicator Settings and Overfitting
A trader may test 10-, 11-, 12-, 13- and 14-period versions of the same indicator until one appears perfect on historical data.
This can be overfitting.
The selected setting may simply match past price behavior by coincidence.
A reasonable parameter should make sense across different market conditions rather than only on one carefully chosen chart.
No setting eliminates false signals.
Momentum Indicators Lag
Many momentum indicators lag to some degree because they depend on historical prices.
Even highly responsive oscillators can only calculate what price has already done.
A signal may therefore appear after part of the move has occurred.
This does not make the indicator useless.
Lag can help smooth noise and provide confirmation.
The problem appears when confirmation is mistaken for prediction.
A Practical Momentum Analysis Process
A simple approach begins with price rather than the oscillator.
First identify the broader trend.
Then mark meaningful support and resistance.
Observe whether the market is trending or ranging.
Next, examine momentum.
Is it strengthening in the direction of the trend?
Is it weakening during a pullback?
Is divergence appearing near a meaningful price area?
Finally, decide what market behavior would invalidate the interpretation.
This sequence keeps momentum analysis connected to actual price structure.
Momentum Indicator Checklist
Before using a momentum signal, consider:
What is the broader trend?
Is the market trending or ranging?
Which timeframe produced the signal?
Is price near meaningful support or resistance?
Is momentum strengthening or weakening?
Does the signal confirm price or diverge from it?
Is volatility unusually high?
Is a major economic announcement approaching?
Would the same signal mean something different in another market environment?
Where would the setup be invalidated?
How much financial risk would the position create?
These questions help prevent one indicator value from dominating the entire decision.
Momentum Indicators FAQs
What are momentum indicators?
Momentum indicators are technical tools that measure aspects of the speed or strength of price movement using mathematical calculations based on market data.
What do momentum indicators tell traders?
They can help show whether directional movement is strengthening, weakening, becoming extended or diverging from price.
Are momentum indicators the same as trend indicators?
No. Trend indicators focus more on direction and persistence, while momentum indicators measure aspects of the force or speed behind price movement.
What is an oscillator?
An oscillator is an indicator that moves within a defined range or around a reference level to represent changing market conditions.
What does overbought mean?
Overbought generally means recent upward momentum is unusually strong relative to the indicator's formula. It does not guarantee a decline.
What does oversold mean?
Oversold generally means recent downward momentum is unusually strong. It does not guarantee that price will rise.
What is momentum divergence?
Momentum divergence occurs when price and an indicator move differently, such as price making a higher high while the indicator forms a lower high.
Does divergence guarantee a reversal?
No. Divergence can persist while the existing trend continues.
What is the Awesome Oscillator?
The Awesome Oscillator compares shorter- and longer-term momentum using moving averages derived from median price.
What is CCI?
CCI, or Commodity Channel Index, measures how far price has moved relative to its statistical average over a selected period.
What is MACD?
MACD is an indicator based primarily on relationships between exponential moving averages and is used to analyze trend and momentum changes.
What is the Detrended Price Oscillator?
The DPO attempts to reduce longer-term trend effects so shorter cyclical price movements become easier to examine.
What is KST?
KST, or Know Sure Thing, combines several smoothed rate-of-change calculations to analyze momentum across different lookback periods.
Which momentum indicator is best?
There is no universally best momentum indicator. The appropriate tool depends on the market, timeframe and type of information the trader needs.
Can I use more than one momentum indicator?
Yes, but several similar momentum tools may provide redundant information rather than genuinely independent confirmation.
Are momentum indicators useful for forex?
Yes. Forex traders commonly use momentum tools to study breakouts, trends, pullbacks and changing strength in currency pairs.
Can momentum indicators be used for gold?
Yes. They can help assess the strength of gold movements, although major economic and geopolitical events can produce rapid changes.
Can momentum indicators be used for indices?
Yes. Momentum tools are commonly applied to index charts, especially during directional market periods.
Can momentum indicators be used for cryptocurrency markets?
Yes, although strong crypto volatility can produce extreme readings that persist longer than traders expect.
Which timeframe works best for momentum indicators?
There is no single best timeframe. The chosen timeframe should match the trader's intended holding period and broader analysis.
Can momentum be bullish on one timeframe and bearish on another?
Yes. A short-term rally can occur inside a larger downtrend, so different timeframes can show different momentum conditions simultaneously.
Do momentum indicators work differently in Pakistan?
The calculations are the same. Traders in Pakistan mainly need to consider when active international sessions and economic releases occur in Pakistan Standard Time.
Are momentum indicators different for traders in KPK?
No. A trader in Peshawar, Mardan, Abbottabad, Swat or another KPK city sees the same indicator calculation for the same price data. Trading schedule and connectivity can affect how short-term signals are practically managed.
Should I buy when an indicator becomes oversold?
Not automatically. Oversold conditions can persist during strong declines, so price structure and confirmation remain important.
Should I sell when an indicator becomes overbought?
Not automatically. Strong uptrends can remain overbought for extended periods.
Can momentum indicators predict breakouts?
They can help assess whether momentum is strengthening around a breakout, but they cannot guarantee that the breakout will continue.
Why do momentum indicators produce false signals?
Markets constantly change between trends, ranges and different volatility conditions. A calculation useful in one environment can become less reliable in another.
Can momentum indicators guarantee profitable trading?
No. Momentum signals can fail, divergences can persist, and leverage can magnify losses when the market moves against a position.
Disclaimer: Momentum indicators measure historical and current changes in price strength, but overbought readings, oversold conditions, divergences, crossovers and accelerating momentum cannot guarantee what a market will do next. Strong trends can remain extended, apparent reversals can fail, and leveraged positions can magnify losses when price moves unexpectedly. This article is provided for general education and is not personalized investment, trading, financial, legal or tax advice. Medatiq's available instruments, platform functionality, spreads, execution conditions and margin requirements may vary or change.
Trade forex, gold, and indices with Medatiq Markets
Enjoy tight spreads and fast execution, built for market condition.